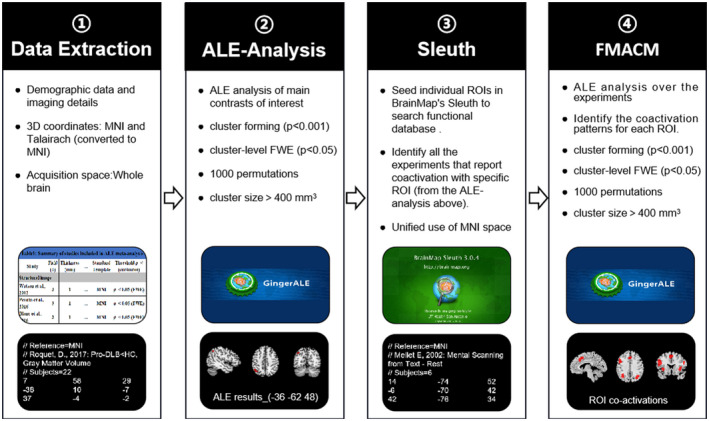
FIGURE 2.

Anatomical/activation likelihood estimation (ALE) and FMACM flowchart. Pipeline showing the process of ALE and FMACM analyses and the related software, Ginger ALE and Sleuth, leading to the brain converging regions and their co‐activation regions. ① Data Extraction: Literature basic information, demographic data, experimental and imaging details and the 3D coordinates were extracted from eligible articles. ② ALE analysis: The main contrasts of interest were performed ALE analysis in MNI space using the Ginger ALE software, leading to the brain converging regions. ③ Sleuth: Create spherical ROIs of nodes using peak foci coordinates of the corrected results from ALE analysis. Then, seed individual ROIs in BrainMap's Sleuth to search functional database. Use MNI brain space. ④ FMACM Analysis: Ginger ALE software was used to perform FMACM analysis with appropriate and consistent thresholds to identify ALE meta‐analysis–co‐activated brain regions
