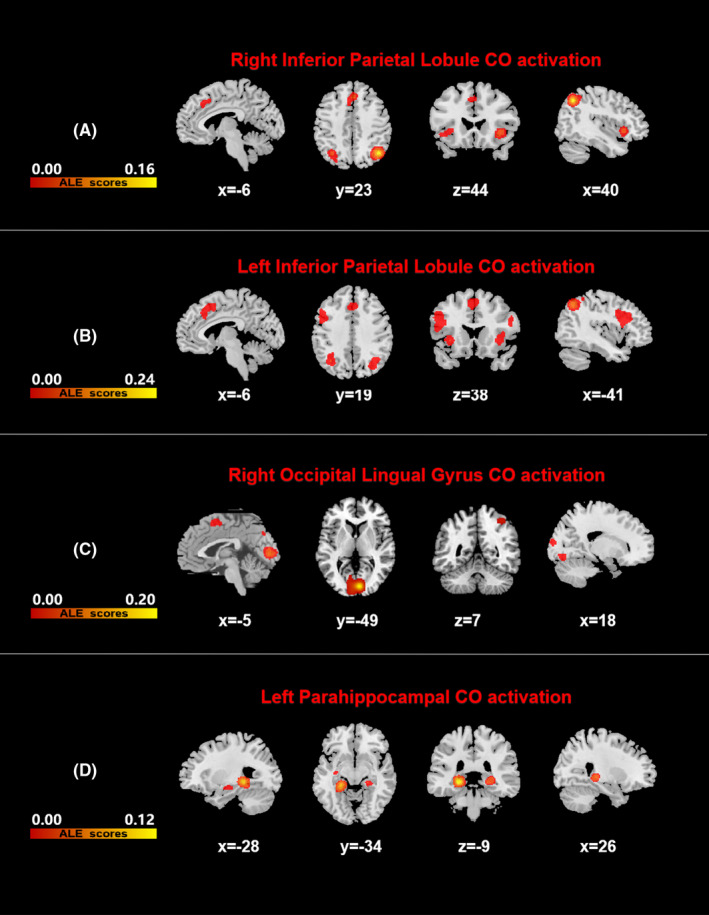
FIGURE 4.

Results of all fMACM co‐activated brain areas. All results were FWE corrected with a cluster‐forming threshold of p < 0.001 and cluster‐level inference of 0.05. Results were superimposed on a brain template using MRIcron software in MNI space. Color bars represent anatomical/activation likelihood estimation scores. DLB, dementia with Lewy body, HCs, healthy controls, AD, Alzheimer's disease
