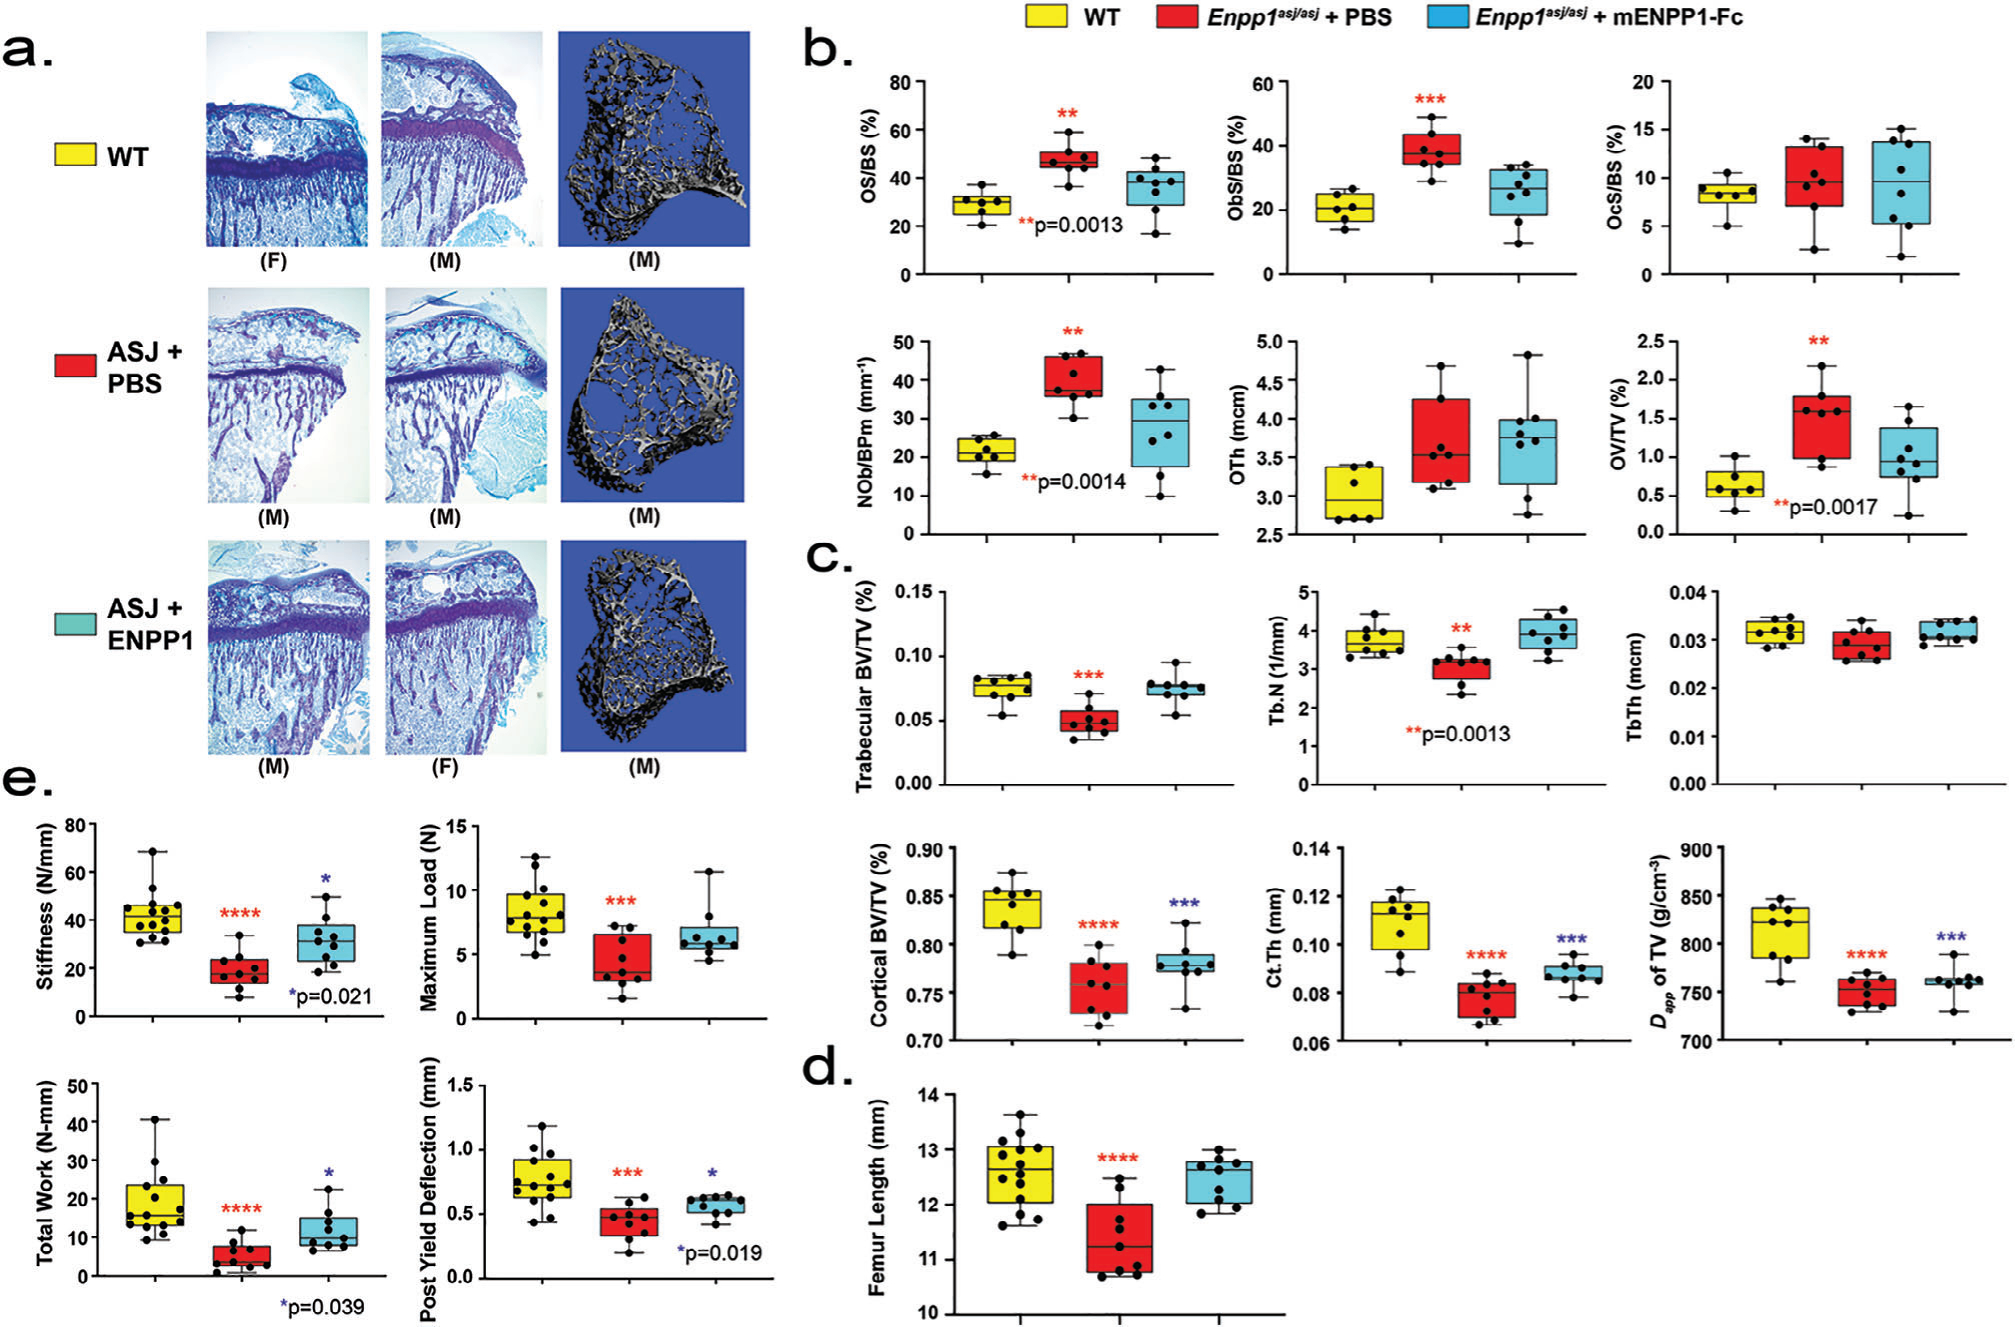
Fig 4.

Bone phenotype of Enpp1asj/asj mice on high-phosphate diet treated with vehicle or mEnpp1-Fc. (A) Proximal tibia histology and micro-CT. Histology of the proximal tibias of 5-week-old mice on the high-phosphate diet are displayed from each experimental cohort to evaluate the skeletal phenotype of Enpp1asj/asj mice and the response to mEnpp1-Fc. ENPP1 deficiency resulted in morphologically apparent reductions in trabecular bone and markedly thinner growth plates. Treating Enpp1asj/asj mice with mEnpp1-Fc markedly increased trabecular bone volume and growth plate thickness. (B) Histomorphometry of female mice: osteoid surface area per bone surface area (OS/BS), osteoblast surface per bone surface (ObS/BS), osteoclast surface per bone surface (OcS/BS), osteoblasts number per bone perimeter (NoB/BPm), osteoid thickness, and osteoid volume per total volume (OV/TV). Individual measurements are displayed as circles with bar height representing median and error bars denoting interquartile range (25% to 75%). (C) Micro-CT quantification in female mice of trabecular BV/TV, trabecular number (Tb.N), trabecular thickness (Tb.Th), cortical BV/TV, cortical thickness (Ct.Th), and apparent density of total volume (TV). Data displayed as in panel B. (D) Biomechanical quantification by 3-point bending of femur bone parameters (stiffness—slope of the load versus displacement curve; max load—also known as strength; total work—the energy needed to fracture the bone; and post-yield deflection—the amount of deformation after the yield point) in male and female mice—14 WT mice treated with PBS (5 F and 9 M), 9 Enpp1asj/asj mice treated with PBS (4 F and 5 M), and 9 Enpp1asj/asj treated with mEnpp1-Fc (4 F and 5 M). Data are displayed as box plots denoting median value and interquartile range, with whiskers denoting minimum and maximum values and individual measurements denoted by circles. The p values are explicitly stated when p falls between .05 and .001. ***p < .001, ****p < .0001, ANOVA comparison of means.
