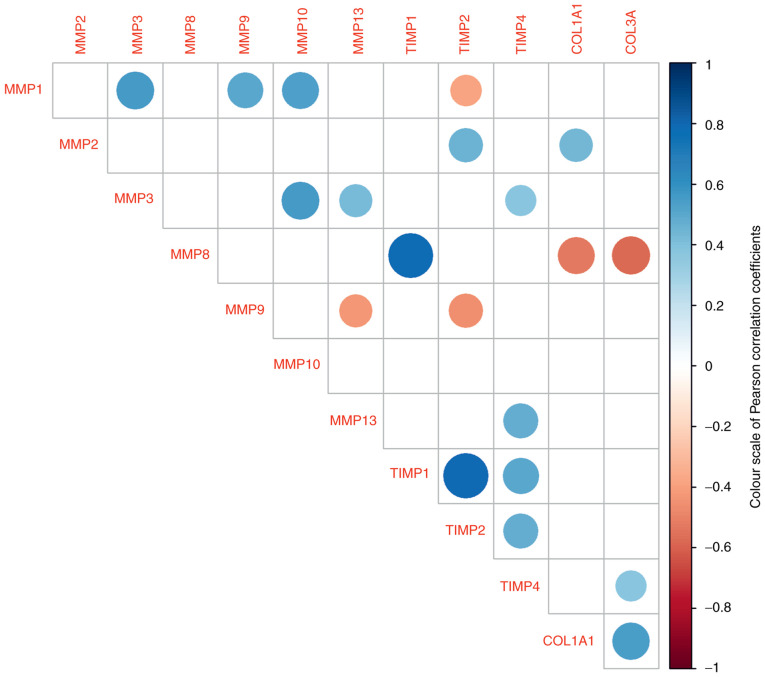
Figure 2.
Correlation matrix of gene log levels for the pairs where the Pearson correlation is statistically significant. The blue colour of the dot represents a positive relationship between a pair of genes, while the red dot indicates a negative relationship. The intensity of the colour and the size of the dots indicate the strength of the correlation. TIMP, tissue inhibitor of metalloproteinases; COL, collagen.

