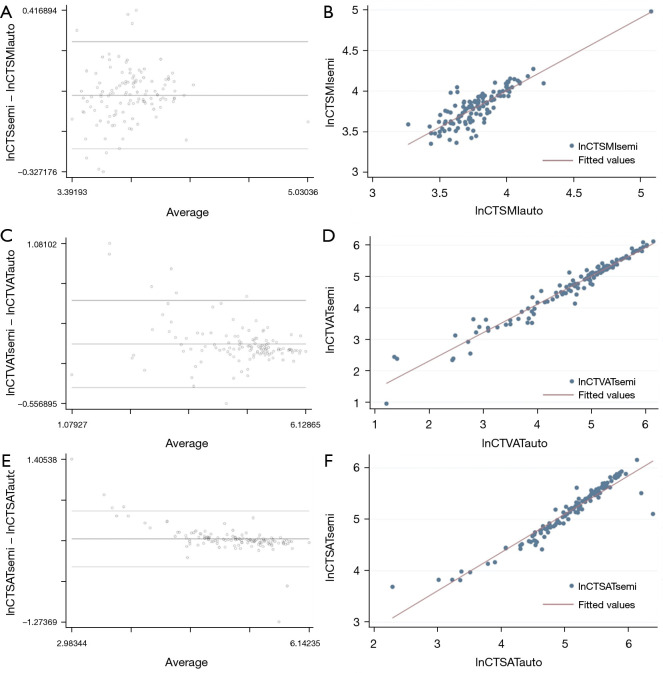
Figure 5.
Bland-Altman plots and linear regression analysis, showing the average on the logarithmic scale of the difference between computed tomography (CT) values extracted by semi-automatic segmentation and automatic segmentation. (A) Bland-Altman plot for SMI (lnCTSMIsemi − lnCTSMIauto). (B) Linear regression analysis for SMI. (C) Bland-Altman plot for VAT (lnCTVATsemi − lnCTVATauto). (D) Linear regression analysis for VAT. (E) Bland-Altman plot for SAT (lnCTSATsemi − lnCTSATauto). (F) Linear regression analysis for SAT. CT, computed tomography; SMI, skeletal muscle index; lnCTSMI, the difference between SMI measured by CT; VAT, visceral adipose tissue; lnCTVAT, the difference between VAT measured by CT; SAT, subcutaneous adipose tissue; lnCTSAT, the difference between SAT measured by CT.

