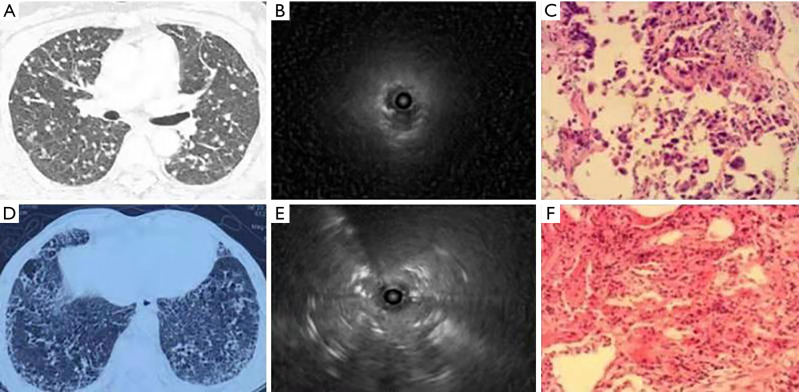
Figure 2.
The EBUS images of nodular lesions and reticulation lesions on chest CT images. (A) Multiple solid and well-defined nodules in both lungs on chest CT imaging; (B) when the echo probe was adjacent to the lesion, low-level echo areas were surrounded by a clearly hypoechoic border on ultrasound; (C) adenocarcinoma cells in the lungs (HE, ×100); (D) reticulation at both lower lungs and local honeycomb changes on chest CT imaging; (E) scattered points and linear hyperechoic regions in a field of whitish acoustic shadows on EBUS; (F) pulmonary fibrosis (HE, ×100). EBUS, endobronchial ultrasound; CT, computed tomography; HE, hematoxylin and eosin staining.

