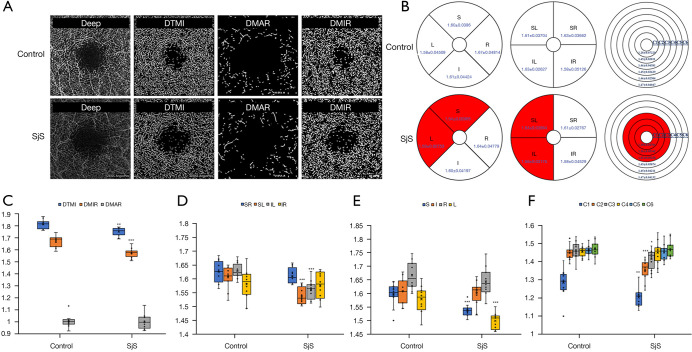
Figure 4.
Comparison of retinal vessel density between SjS and control groups in deep retinal layers. The optical coherence tomography angiography image of the deep retinal layer (A). Deep retinal microvascular in different partition methods (B). Box plot of microvascular densities in deep retinal layer (C). Box plot of microvascular densities in hemisphere segmentation method (D). Box plot of microvascular densities in EDTRS method (E). Box plot of microvascular densities in central wheel division (F). SjS, Sjögren syndrome; DTMI, deep total microvascular; DMAR, deep macrovascular; DMIR, deep microvascular; R, right; L, left; S, superior; I, inferior; SR, superior right; SL, superior left; IR, inferior right; IL, inferior left. *P<0.05; **P<0.01; ***P<0.001.

