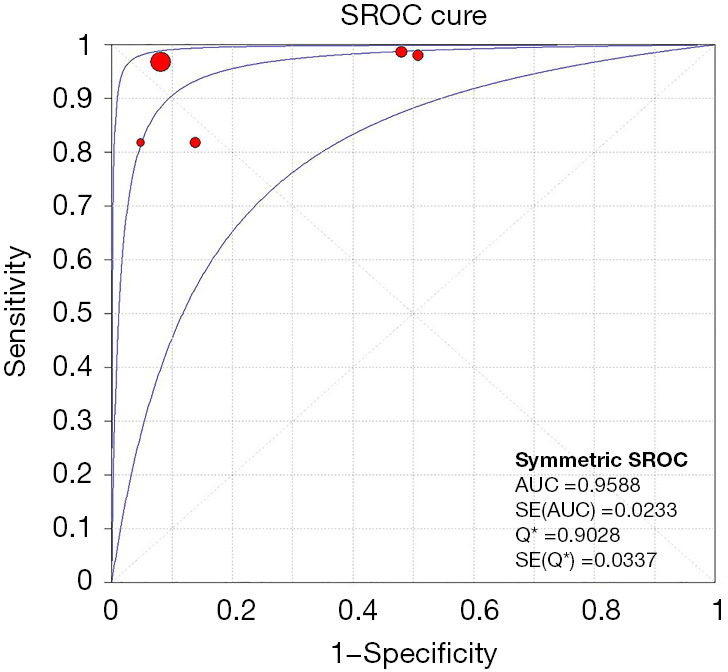
Figure 4.

SROC curves for CEUS in the diagnosis of SLN. Solid circles represent the individual studies included in this meta-analysis. The curve shown is a regression line that summarizes the overall diagnostic accuracy. SE (AUC), standard error of the area under the curve; SROC, summary receiver operating characteristic; Q*, an index defined by the point on the SROC where the sensitivity and specificity are equal; SE (Q*), Q* index standard error; CEUS, contrast-enhanced ultrasound; SLN, sentinel lymph node.
