Fig. 4.
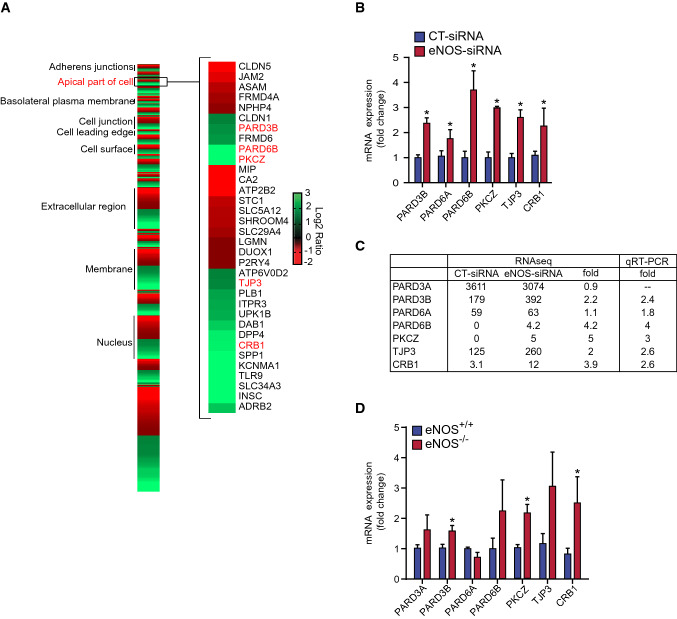
eNOS down-regulation increases the expression of several polarity genes. A Heat map showing the cellular component of eNOS regulated gene products obtained by RNA-seq analysis. BAECs were transfected with CT-siRNA or eNOS-siRNA. RNA was then extracted and submitted for RNA-Sequencing. The reads were aligned to the UMD3.1 genome with TopHat, using the Ensembl annotation. A threshold of fold change > 2 or < 0.5 was used to define the regulated genes. These genes were submitted to the DAVID database and categorized using gene ontology cellular component annotation. Genes composed of the “apical part of cell” (GO: 0045177) are shown. B qRT-PCR validation of genes of interest identified from the RNA-seq analysis of siRNA transfected BAECs. Gene expression analysis was performed using the comparative cycle threshold method, normalized using reference gene GAPDH expression and presented as the mean fold change (± SEM) compared with control. Results are averages of three independent experiments, each performed in quadruplicates. C Summary table of RNA-seq and qPCR results. D Mouse lung endothelial cells (MLECs) from wildtype (eNOS+/+) and eNOS−/− mice were cultured, and expression of polarity genes were measured by qRT-PCR, normalized to GAPDH or β-actin housekeeping genes, and expressed as fold change of eNOS+/+ cells. Results are averages of four independent experiments, each performed in quadruplicates. Results are displayed as mean values ± SEM. *p < 0.05

