Fig. 7.
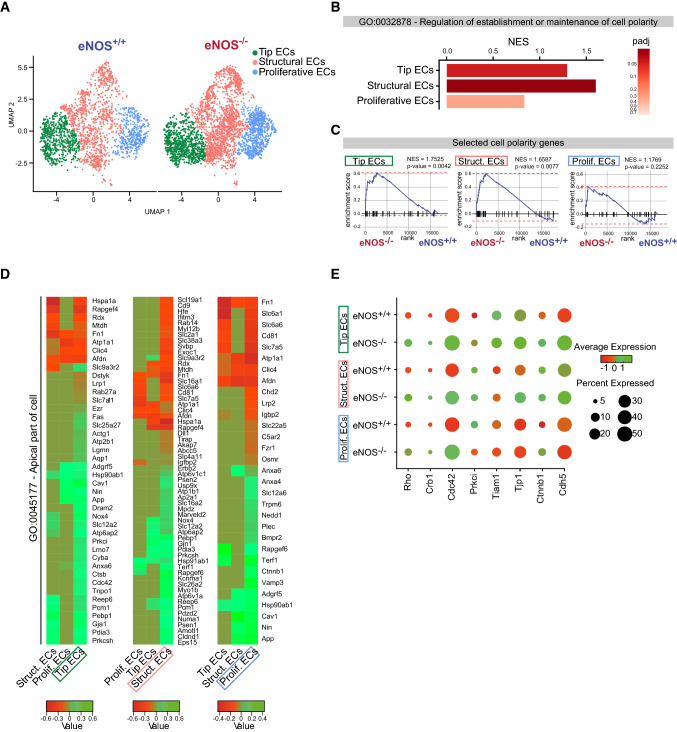
Single-cell RNA-sequencing analysis of ECs of retinas from eNOS−/− mice compared to WT at P14 of OIR. A Uniform Manifold Approximation and Projection (UMAP) analysis and representation of single-cell gene expression of P14 OIR retinas from eNOS+/+ and eNOS−/− (n = 4 per group) shows three identified EC subpopulations (tip, structural and proliferative). B Bar graph of the Normalized Enrichment Score (NES) of the ¨GO: 0032878 Regulation of establishment or maintenance of cell polarity¨ in tip, structural and proliferative ECs. C Gene set enrichment analysis (GSEA) of curated cell polarity gene signature in P14 OIR eNOS-/- and eNOS+/+ retina in tip, structural and proliferative ECs (p-value and NES of each GSEA are indicated). D Heatmaps of the ¨GO: 0045177 Apical Part of Cell¨ showing enrichment in deficient eNOS P14 OIR retinas in the three sub-populations of ECs. E Dot plot demonstrates enrichment of polarity genes expression in the three EC subpopulations eNOS−/− compared to eNOS+/+. Dot size corresponds to proportion of cells within the group expressing each transcript, and dot color corresponds to expression level (green high and red low expression)

