Figure 5.

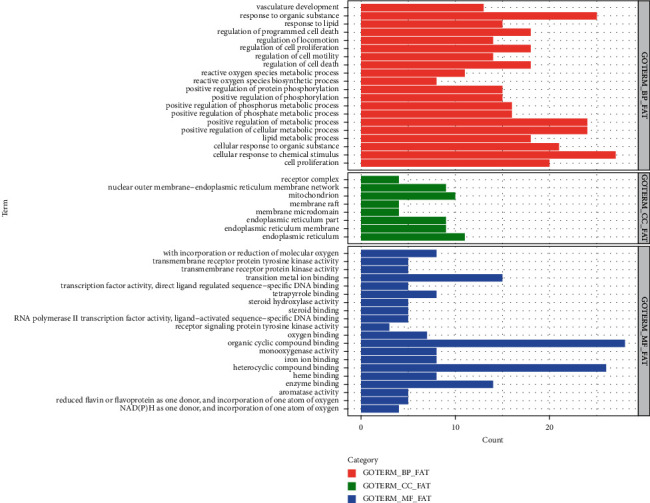
The histogram of the GO function of the POF targets mediated by DBD. The red indicates biological processes (BP), green indicates cell compositions (CC), and blue indicates molecular functions (MF).

The histogram of the GO function of the POF targets mediated by DBD. The red indicates biological processes (BP), green indicates cell compositions (CC), and blue indicates molecular functions (MF).