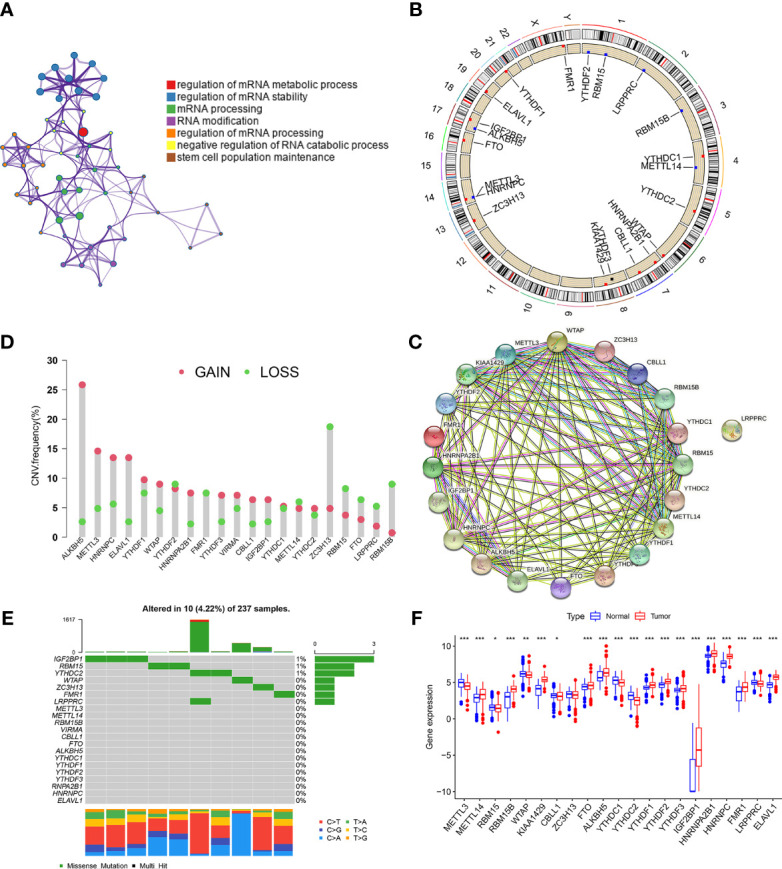
Figure 1.

Landscape of m6A regulators in STS. (A) GO enrichment plot showing seven important terms related with m6A regulators. (B) The location of CNV alteration of m6A regulators on 23 chromosomes in TCGA-SARC cohorts. (C) The CNV variation frequency of m6A regulators in TCGA-SARC corhort. The height of the column represented the alteration frequency. Green dot and red dot represented the deletion frequency and the amplification frequency, respectively. (D) The protein-protein interactions between 21 m6A regulators. (E) The mutation frequencies of m6A regulators in TCGA-STS cohort. Each column represented an individual sample. The upper barplot showed tumor mutation load and the number on the right indicated the mutation frequency in each regulator. (F) The expression of 21 m6A regulators between normal tissues from Genotype-Tissue Expression samples and STS tissue from TCGA-SARC cohort. The statistical difference was compared through the Kruskal–Wallis test. *P < 0.05; **P < 0.01; ***P < 0.001.
