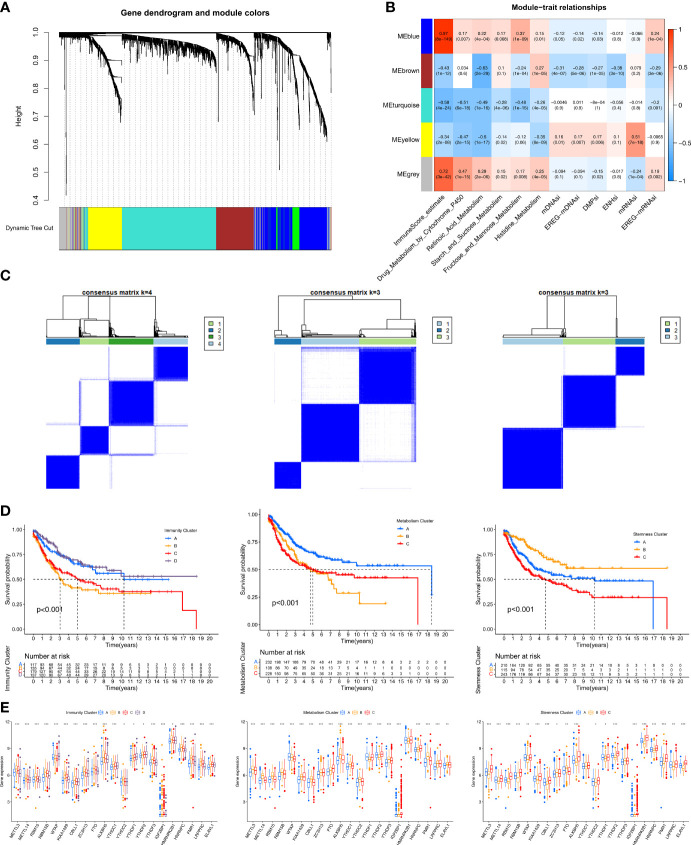
Figure 3.
Identification of hub genes and immunity/metabolism/stemness subtypes by WGCNA.(A) Hierarchical clustering dendrograms of identified co-expressed genes in modules. The branches of the cluster dendrogram correspond to the different gene modules. Each leaf on the cluster dendrogram corresponds to a gene. Each colored row represents a color-coded module which contains a group of highly connected genes. (B) Correlations between the gene modules and clinical traits. The correlation coefficient in each cell represented the correlation between the gene module and the clinical traits. The corresponding P-value and Correlation value are annotated. (C) Heatmap corresponding to the consensus matrix for k=4 (left), 3 (middle), 3 (right) obtained by consensus clustering. (D) Kaplan–Meier curves using the Log-rank test for immunity (left), metabolism (middle) and stemness (right) clusters respectively. (E) The expression of 21 m6A regulators between four immunity (left), metabolism (middle) and stemness (right) clusters. The statistical difference of clusters was compared through the Kruskal–Wallis test. *P < 0.05; **P < 0.01; ***P < 0.001.

