Figure 5.
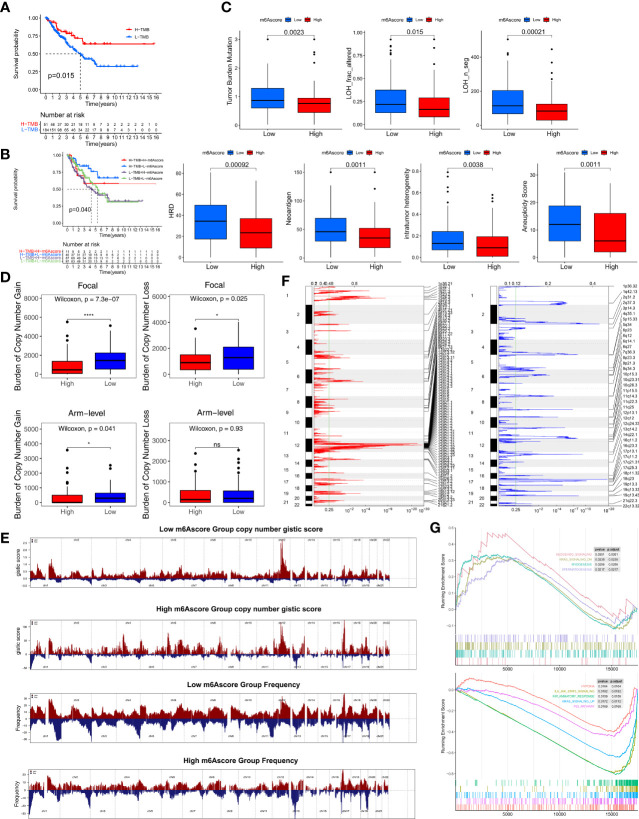
Multiomics analysis of the role of m6Ascore. (A) Kaplan-Meier curves depicting survival analyses for low (184 cases) and high (51 cases) TMB patient groups in the TCGA-SARC cohort using Log-rank test. (B) Kaplan-Meier curves depicting survival analyses for subgroup patients stratified by both m6Ascore and TMB levels using Log-rank test. (C) Differences in the m6Ascore between TMB, neoantigen burden, DNA damage including homologous recombination deficiency (HRD), loss of heterozygosity (LOH; number of segments with LOH events, and fraction of bases with LOH events), intratumor heterogeneity (ITH), and aneuploidy score in the TCGA-SARC cohort. The upper and lower ends of the boxes represented an interquartile range of values. The lines in the boxes represented the median value, and the dots showed outliers. (D) Distribution of and focal and broad (arm-level) copy number alterations in the low or high m6Ascore groups. The statistical significance of pairwise comparisons is annotated with symbols in which ns and * represent not significant (P > 0.05) and P ≤ 0.05, respectively. (E) Copy number profiles for the low or high m6Ascore groups, with gains in red and losses in blue. Gene segments are placed according to their location on chromosomes, ranging from chromosome 1 to chromosome 22. (F) Detailed cytoband with focal amplification (left) and focal deletion (right) in the low-m6Ascore group generated with GISTIC_2.0 software. The q value of each locus is plotted horizontally. (G) GSEA plots showing the activated and suppressed gene sets between the high and low m6Ascore groups. Each run was performed with 1,000 permutations. ns, no significant.

