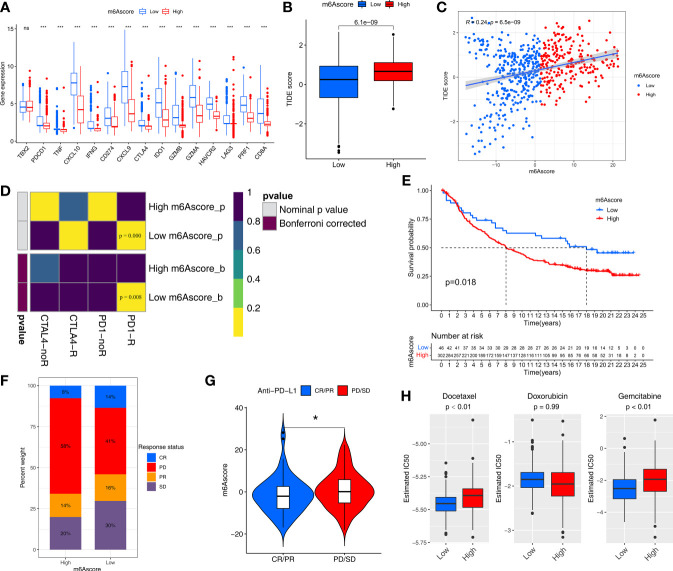
Figure 6.
m6Ascore predicts responses to immunotherapy and chemotherapy. (A) Differences in the expression of immune checkpoint genes between the low and high m6Ascore groups in the TCGA-SARC and GSE21050 cohort. The statistical difference of clusters was compared through the Kruskal–Wallis test. *P < 0.05; ***P < 0.001. ns, no significant. (B) Differences in the TIDE scores between the low and high m6Ascore groups in the TCGA-SARC and GSE21050 cohort. The thick line represents the median value. (C) Scatter plots depicting the positive correlation between TIDEscore and m6Ascore in the TCGA-SARC and GSE21050 cohort by the Spearman correlation analysis. The dotted color indicates the low (blue) and high (red) m6Ascore groups. (D) Submap analysis manifested that low-m6Ascore groups could be more sensitive to the programmed cell death protein 1 inhibitor (Bonferroni-corrected P = 0.008). (E) Kaplan-Meier curves for high and low m6Ascore patient groups in the IMvigor210 cohort. (F) The proportion of patients in the IMvigor210 cohort with clinical response in low or highm6Ascore groups. (G) Violin plot showing differences in the m6Ascore among patients with different clinical responses in the IMvigor210 cohort using Kruskal–Wallis test. The statistical difference of clusters was compared through the Kruskal–Wallis test. *P < 0.05. (H) The box plot of the estimated IC50 for Docetaxel, Docetaxel and Gemcitabine are shown between the low and high m6Ascore groups.

