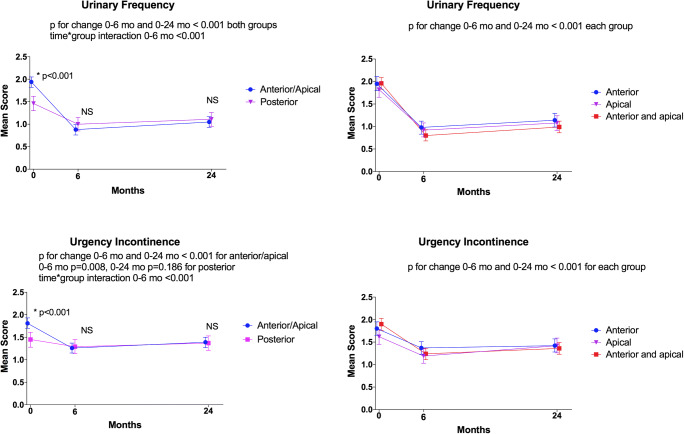
Fig. 3.
Impact of surgery on overactive bladder symptoms. Impact of prolapse surgery on the overactive bladder symptom severity during the follow-up is shown. On the Y-axis, estimated marginal means (and their 95% confidence intervals) from linear generalized estimating equations multivariable model (scale 0–4, higher number indicating higher symptom bother: 0: symptom not present, 1: symptom present but not at all bothersome; 2: symptom somewhat bothersome; 3: symptom moderately bothersome; 4: symptom quite a bit bothersome). On the X-axis, follow-up points. On the left column, data stratified into two surgical groups. On the right, anterior/apical group stratified into three groups. The asterisk indicates P < 0.05, and NS indicates not significant (P > 0.05) for between-group comparison in an ordinal logistic generalized estimated equations model at different time points. P-values for within-group improvement and time*group interaction are reported for ordinal models. Between-group comparisons performed only for two groups (i.e., anterior/apical vs. posterior)

