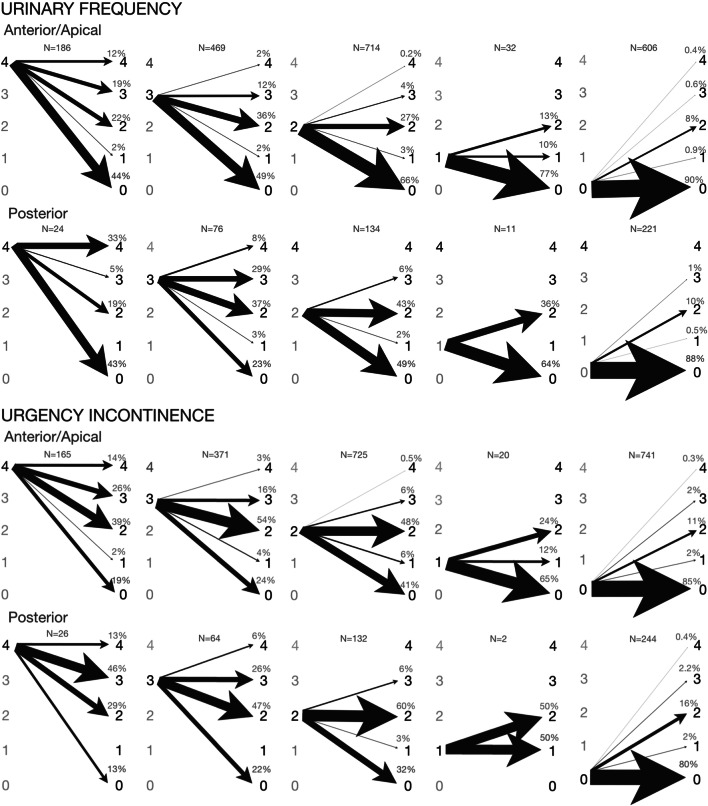
Fig. 4.
Change in symptom severity from baseline to 6 months for each overactive bladder symptom stratified by baseline symptom severity in the anterior/apical and the posterior groups. Each image depicts change in symptom severity from baseline to 6 month’s follow-up stratified by baseline symptom severity: baseline symptom severity on the left and 6 months’ symptom severity on the right. The scale of symptom severity: 4: symptom quite a bit bothersome; 3: symptom moderately bothersome; 2: symptom somewhat bothersome; 1: symptom present but not at all bothersome; 0: symptom not present. The thickness of the arrow is proportional to percentage

