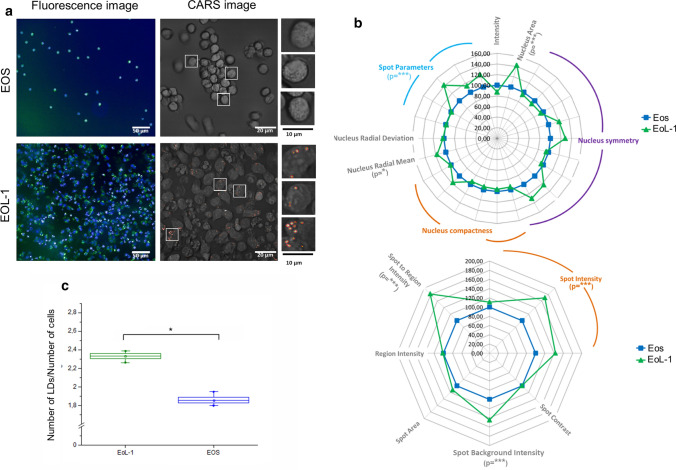
Fig. 1.
a Fluorescence (Hoechst nuclei—blue and BODIPY LBs—green, magnification 20×, NA = 0.5) and coherent anti-Stokes Raman scattering images (CARS, magnification 40×, NA = 0.8) of primary Eos and unstimulated EoL-1. b Multi-parametric morphological analysis of nuclei (upper) and LBs (lower) from fluorescence images. The significance was calculated with the Mann–Whitney test (*p < 0.05, **p < 0.01, ***p < 0.001) and it is shown underneath the parameters in brackets. c The relative number of LBs, shown as a graph of the number of LBs per number of cells, calculated from fluorescence images (N of EoL-1: 1430, N of Eos: 157). Values are given as mean ± SEM (standard error of mean) and are shown in box plots: mean (horizontal line), SEM (box), minimal and maximal values (whiskers). The significance was calculated with the Mann–Whitney test (*p < 0.05)

