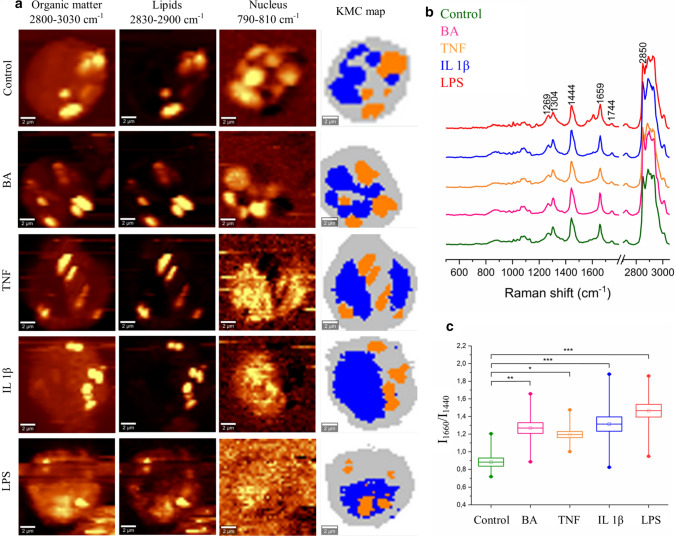
Fig. 4.
a Raman distribution images of selected chemical components: organic matter, lipids, and DNA and false-colour KMC map of representative cells of control and stimulated EoL-1 cells. Three classes were assigned to the cytoplasm (grey), LBs (orange), and nuclei (blue). Raman distribution images were constructed by integration of characteristic bands for organic matter (2800–3030 cm-1), lipids (2830–2900 cm-1), and nuclei (780–800 cm-1). b Mean spectra (n = 15) ± SD (shading) of the LB class for each group of cells, with assigned Raman bands characteristic for lipids, (c) analysis of the degree of unsaturation of the lipid class in EoL-1 cells calculated using the integrated intensity ratio of bands 1660 and 1440 cm-1. Values are given as mean ± SEM and are shown in box plots: mean (horizontal line), SEM (box), minimal and maximal values (whiskers). *p < 0.05, **p < 0.01, ***p < 0.001

