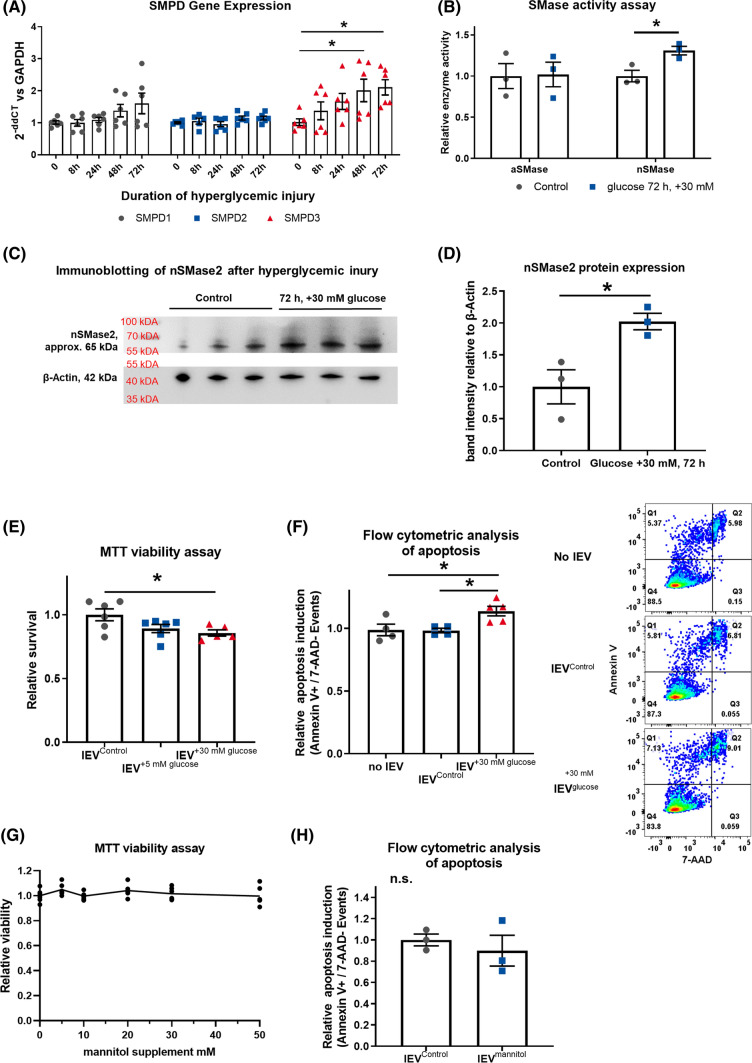
Fig. 2.
A Timeline of gene expression of SMPD1-3 in HCAECs after hyperglycemic injury, presented as 2−ddCT vs GAPDH, n = 6. B Acidic and neutral SMase enzyme activity in HCAECs after 72 h of hyperglycemic injury, n = 5–6. C + D Immunoblotting for nSMase2 and β-Actin after 72 h of hyperglycemic injury, with quantification, n = 3. E MTT viability assay in HCAECs that were treated with lEVs from HCAECs after hyperglycemic injury, n = 6. F Flow-cytometric analysis of the induction of apoptosis in HCAECs that were treated with lEVs from HCAECs after hyperglycemic injury, (right) representative dot blots, n = 5. G MTT viability assay in HCAECs after treatment with mannitol, n = 6. H Flow-cytometric analysis of the induction of apoptosis in HCAECs that were treated with lEVs from HCAECs after osmotic injury with mannitol, n = 3. All data are presented as individual experiments with the mean ± SEM; n.s. not significant, *p < 0.05, ANOVA + Bonferoni’s multiple comparison test were used for A, E, G, and unpaired t-Test for B, D, F, H

