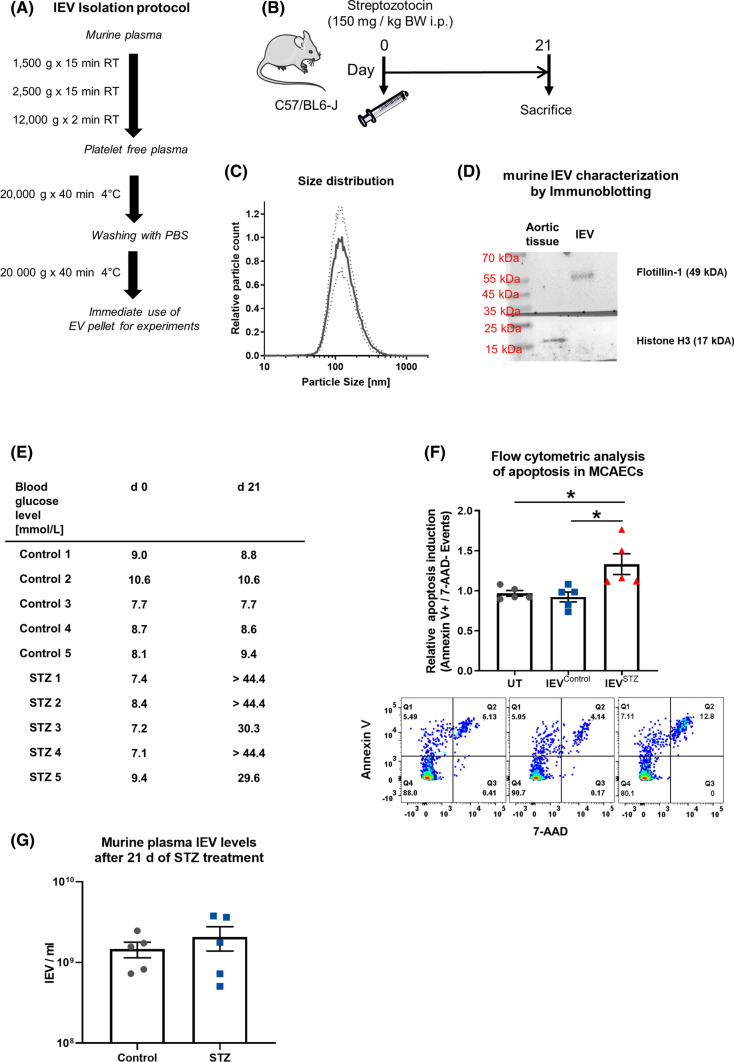
Fig. 3.
A Schematic diagram of the lEV isolation protocol from murine blood. B Diagram of the experimental set-up of the mouse experiment to induce hyperglycemia through streptozotocin injection. C Analysis of murine lEV size distribution by nanoparticle tracking analysis, n = 3. D Characterization of lEVs by immunoblotting for Histone H3 and Flotillin-1. E Table of individual blood sugar levels of the mice. F Flow-cytometric analysis of the induction of apoptosis in MCAECs that were treated with lEVs from hyperglycemic and normoglycemic mice, n = 5. G Nanoparticle tracking analysis of lEV concentration in murine plasma from control animals and STZ-treated animals, n = 5. *p < 0.05, ANOVA + Bonferoni’s multiple comparison test was used for E

