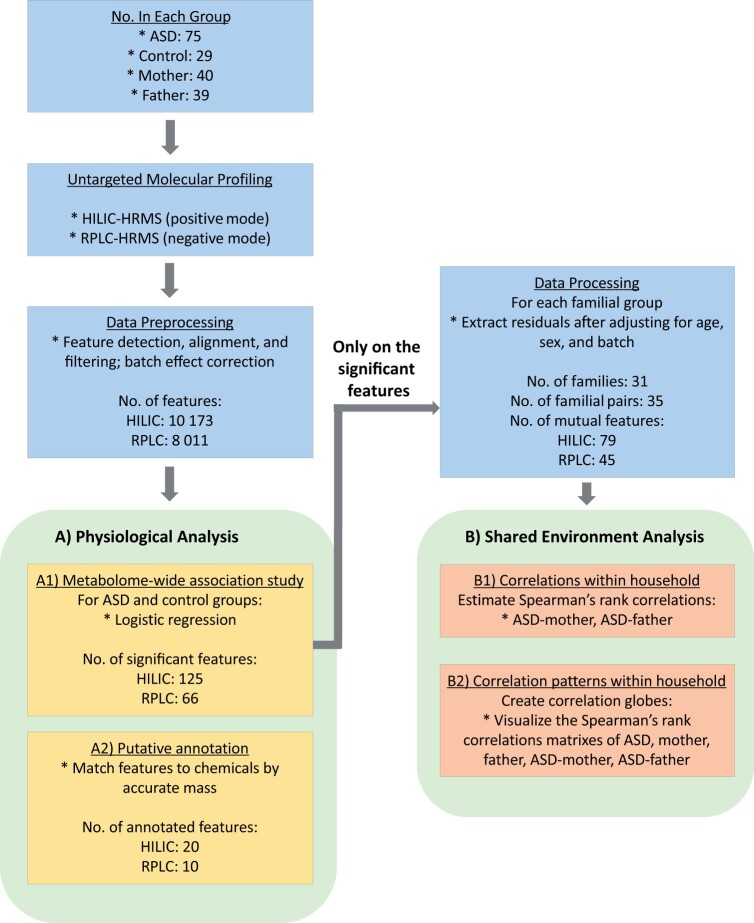
Figure 1.
Overview of the data collection and statistical analyses conducted in this study. After collecting plasma samples of ASD cases, controls, and parents of ASD, we used two analytical platforms, HILIC and RPLC that were coupled with high-resolution mass spectrometry (HRMS) to conduct untargeted metabolic profiling. Raw data was processed, including feature detection, peak alignment, batch effect correction, and feature filtering before the data sets were sent to downstream analysis. For physiological analysis, we first run (A1) an MWAS on cases and controls to identify significant features associated with ASD (FDR = 0.05). Then we (A2) putatively named the compounds by matching their accurate masses to those unambiguously found in metabolite databases. Using the MWAS selected features, we conducted the shared environment analyses after adjusting for confounders (i.e., analyzed the extracted residuals from the adjusting model). We (B1) first investigated the Spearman’s rank correlations within households (i.e., in proband-mother, proband-father). Then we (B2) visualized the correlation patterns within households as correlation globes.

