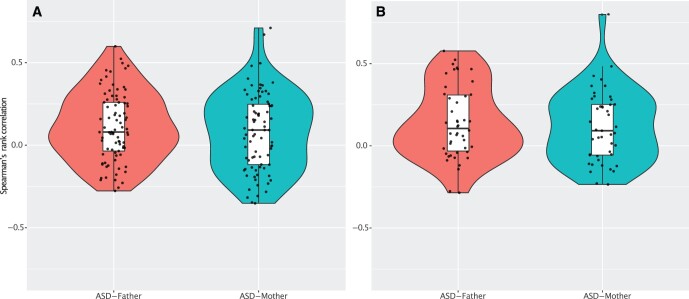
Figure 2.
Violin plots showing the distributions of the correlations of ASD–associating features within the ASD families. (A) HILIC platform; (B) RPLC platform. Using the significant features found in the MWAS, we estimated the Spearman’s rank correlation for each feature between proband-mother, proband-father. The number of shared features for estimating correlations were 79 (HILIC) and 45 (RPLC) after data preprocessing for familial analysis. In each plot, we overlaid with a one-dimensional scatter plot and a boxplot showing median, interquartile ranges, and whiskers extending to the largest values within 1.5*interquartile range.

