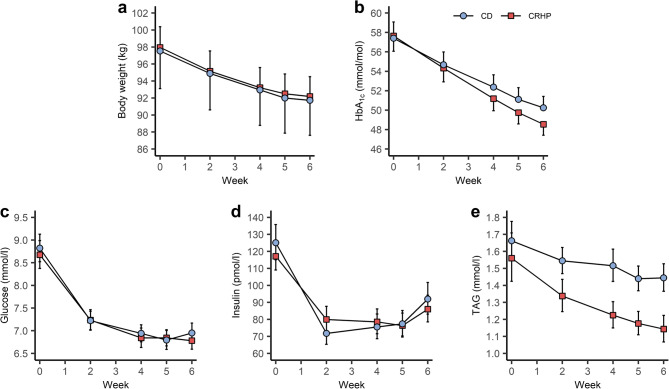
Fig. 2.
Fasting measures of body weight (p = 0.83) (a), HbA1c (p = 0.018) (b), plasma glucose (p = 0.64) (c), serum insulin (p = 0.92) (d) and serum triacylglycerol (TAG) (p < 0.01) (e) during 6 weeks of a CRHP (n = 34) or CD (n = 33) diet. Data are presented as mean with SEM error bars, including back-transformed data in (c–e) following log-transformation. Changes from baseline to week 6 were evaluated between diets, and p values for these differences are included

