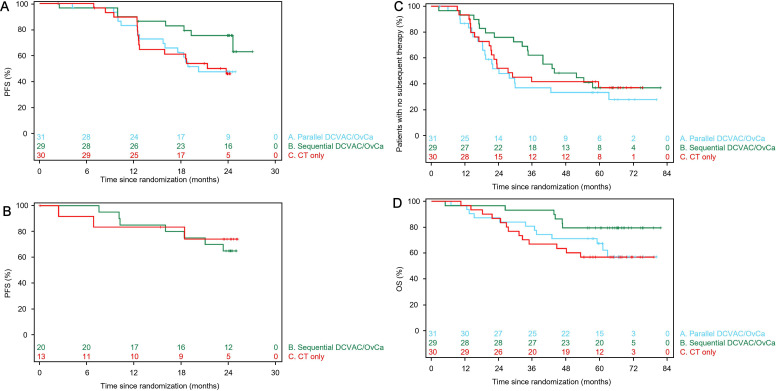
Figure 2.
Kaplan-Meier plots of progression-free survival in Parts 1 (A) and Part 2 (B), patients without subsequent therapy in Part 1 (C), and overall survival in Part 1 (D). Plots are shown for the modified intention-to-treat analysis set. CT, chemotherapy; Group A, DCVAC/OvCa in parallel with CT; Group B, CT and sequential DCVAC/OvCa; Group C, CT only; OS, overall survival; PFS, progression-free survival.

