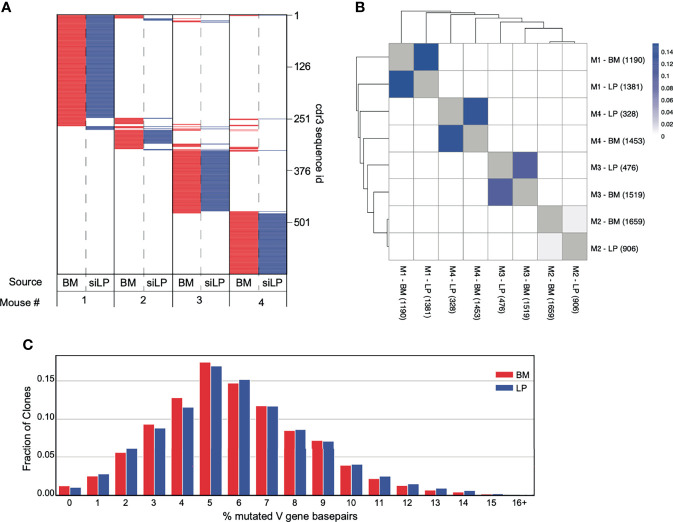
Figure 4.
Significant overlap of clones between IgA+ plasma cells from the BM and siLP. VHDHJH rearrangements were amplified from cDNA prepared from sorted siLP and BM IgA+ plasma cells and sequenced on an Illumina MiSeq. Sequences were quality filtered and collapsed into clones as described in materials and methods. Clones were filtered based on size such that clones with a copy number less than 50% of the mean copy number frequency (50% mcf) within the subject were excluded. (A) Representation of CDR3s overlapping in at least two IgA+ biological samples. Each horizontal line represents a unique CDR3 sequence, the presence of red (bone marrow) or blue (siLP) indicates an overlapping sequence was detected in a sample and white indicates the absence of that CDR3 in a given sample. The total number of clones is shown on the right side of the plot. (B) Jaccard index was calculated to compare mouse clonal overlap of BM and siLP between vs. within each mouse. Each clone counts once, disregarding clone size. Numbers in parenthesis are the number of clones included in this study for a given sample. (C) Somatic hypermutation percentage histogram of IgA+ clones stratified by BM and LP. The degree of SHM within each clone was averaged across each unique sequence and weighted by the number of copies.

