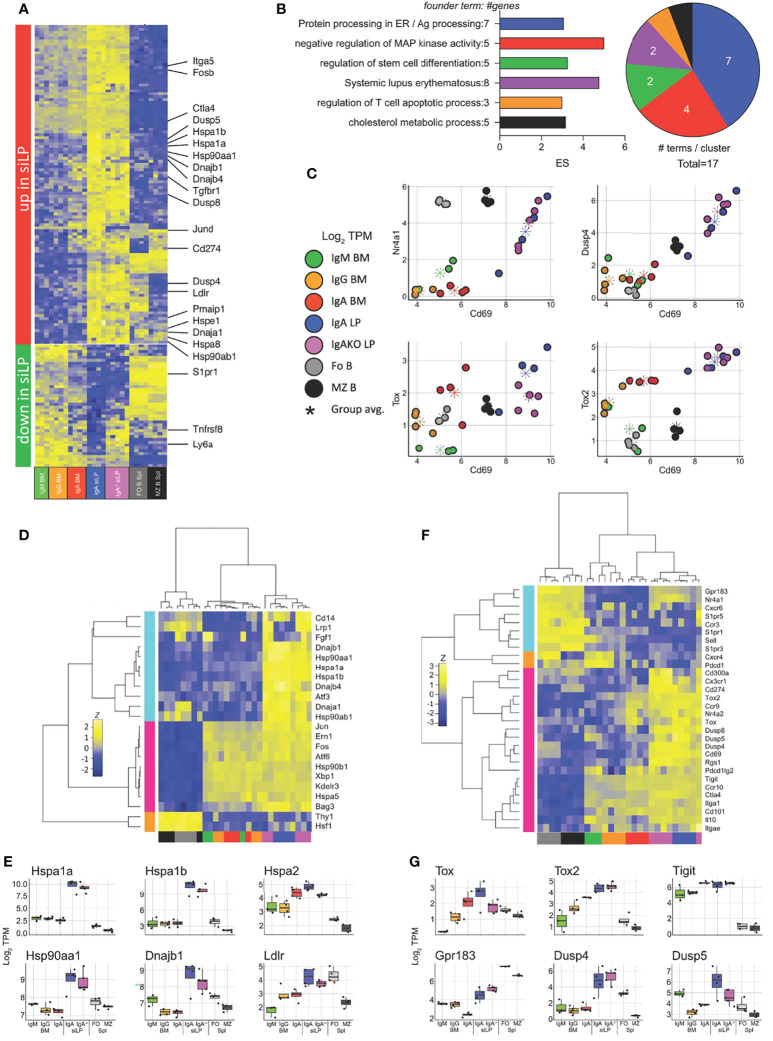
Figure 6.
Lamina propria plasma cells express a unique transcriptional program in response to tissue-specific signals. RNA-seq was performed as in Figure 5 with the addition of plasma cells sorted from the siLP of B6.Blimp1+/GFP.IgA-/- mice. (A) Genes differentially up and down regulated in IgA+ siLP plasma cells compared with all BM plasma cell subsets by at least 2-fold with an adjusted P value <.01 are shown with focus genes highlighted. Complete lists of differential genes are found in Supplementary Table 1 . (B) Gene ontology cluster enrichment analysis for IgA+ siLP plasma cell-specific genes is shown. For each cluster, the founder term was chosen as the term with most significant Bonferroni step down adjusted P value. The number of genes for the cluster term is shown following the term name. The enrichment score [-log10(adj-P)] is shown as bar length while the pie slice indicates number of enriched terms grouped in each cluster. (C) Scatter plots of all groups and all animals for the indicated two gene comparisons is shown as log2 TPM expression (colored circles). The colored asterisk indicates the average for each displayed group. (D) plasma cell-related UPR gene and heat shock gene expression is shown. Genes and samples were allowed to cluster freely by Pearson and Spearman correlation, respectively. (E) Individual log2 TPM gene expression magnitude is shown for selected genes as the mean (bar), 75% c.i. (box), 95% c.i. (whisker), and individual values for each animal (jitter). (F) Genes contributing to tissue residency, central lymphoid residency and effector cell exhaustion were used to cluster samples as in (D). (G) Individual log2 TPM gene expression magnitude is shown for selected genes as in (E). Differential gene expression in (A) was determined by empirical Bayes method with Benjamini and Hochberg correction for multiple comparisons.

