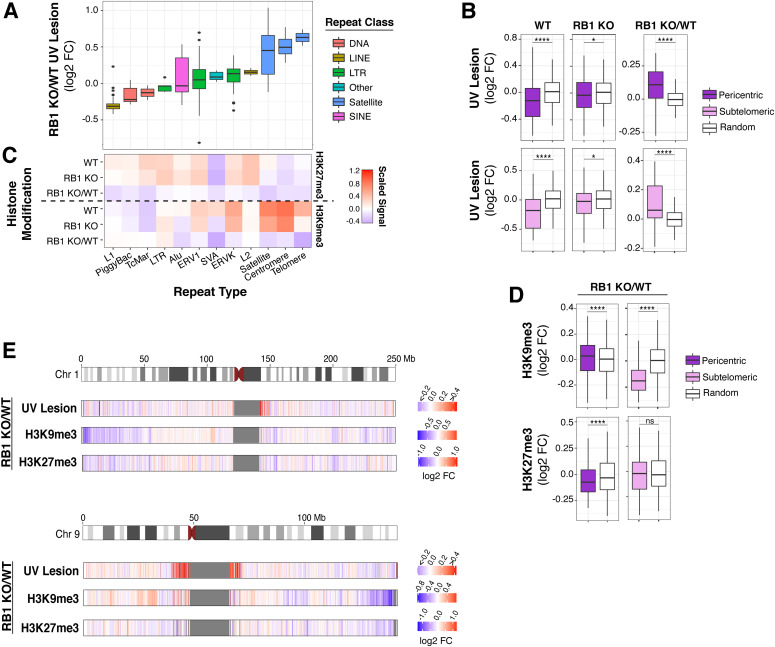
Figure 3. Centromeric and telomeric regions are more susceptible to UV following RB1 knockout.
(A) Box plots of UV lesion log2 fold change (FC) in RB1 KO cells compared with wild-type (WT) (RB1 KO/WT) in selected families of repeat sequences. (B) Box plots of UV lesion abundance in pericentric or subtelomeric regions, defined as 1 Mb bins next to centromeres or 100 kb next to telomeres, in RB1 KO, WT, and RB1 KO/WT FC. Mann–Whitney U test indicates significant difference between 1,000 groups of random regions and selected regions (ns, not significant, *P < 0.05, **P < 0.01, ***P < 0.001, ****P < 0.0001). (C) Heat map of scaled median H3K9me3 and H3K27me3 ChIP signal for RB1 KO, WT, and RB1 KO/WT FC in selected families of repeat sequences. For each histone modification, the signal is normalized to genome median for visualization. (D) Box plots of H3K9me3 and H3K27me3 ChIP signal in pericentric and subtelomeric regions, for RB1 KO, WT, and RB1 KO/WT FC. Mann–Whitney U test indicates significant difference between 1,000 groups of random regions and selected regions (ns, not significant, *P < 0.05, **P < 0.01, ***P < 0.001, ****P < 0.0001). (E) Heat maps of RB1 KO/WT log2 FCs in UV lesion, H3K9me3, and H3K27me3 signal in 100-kb bins along selected chromosomes.

