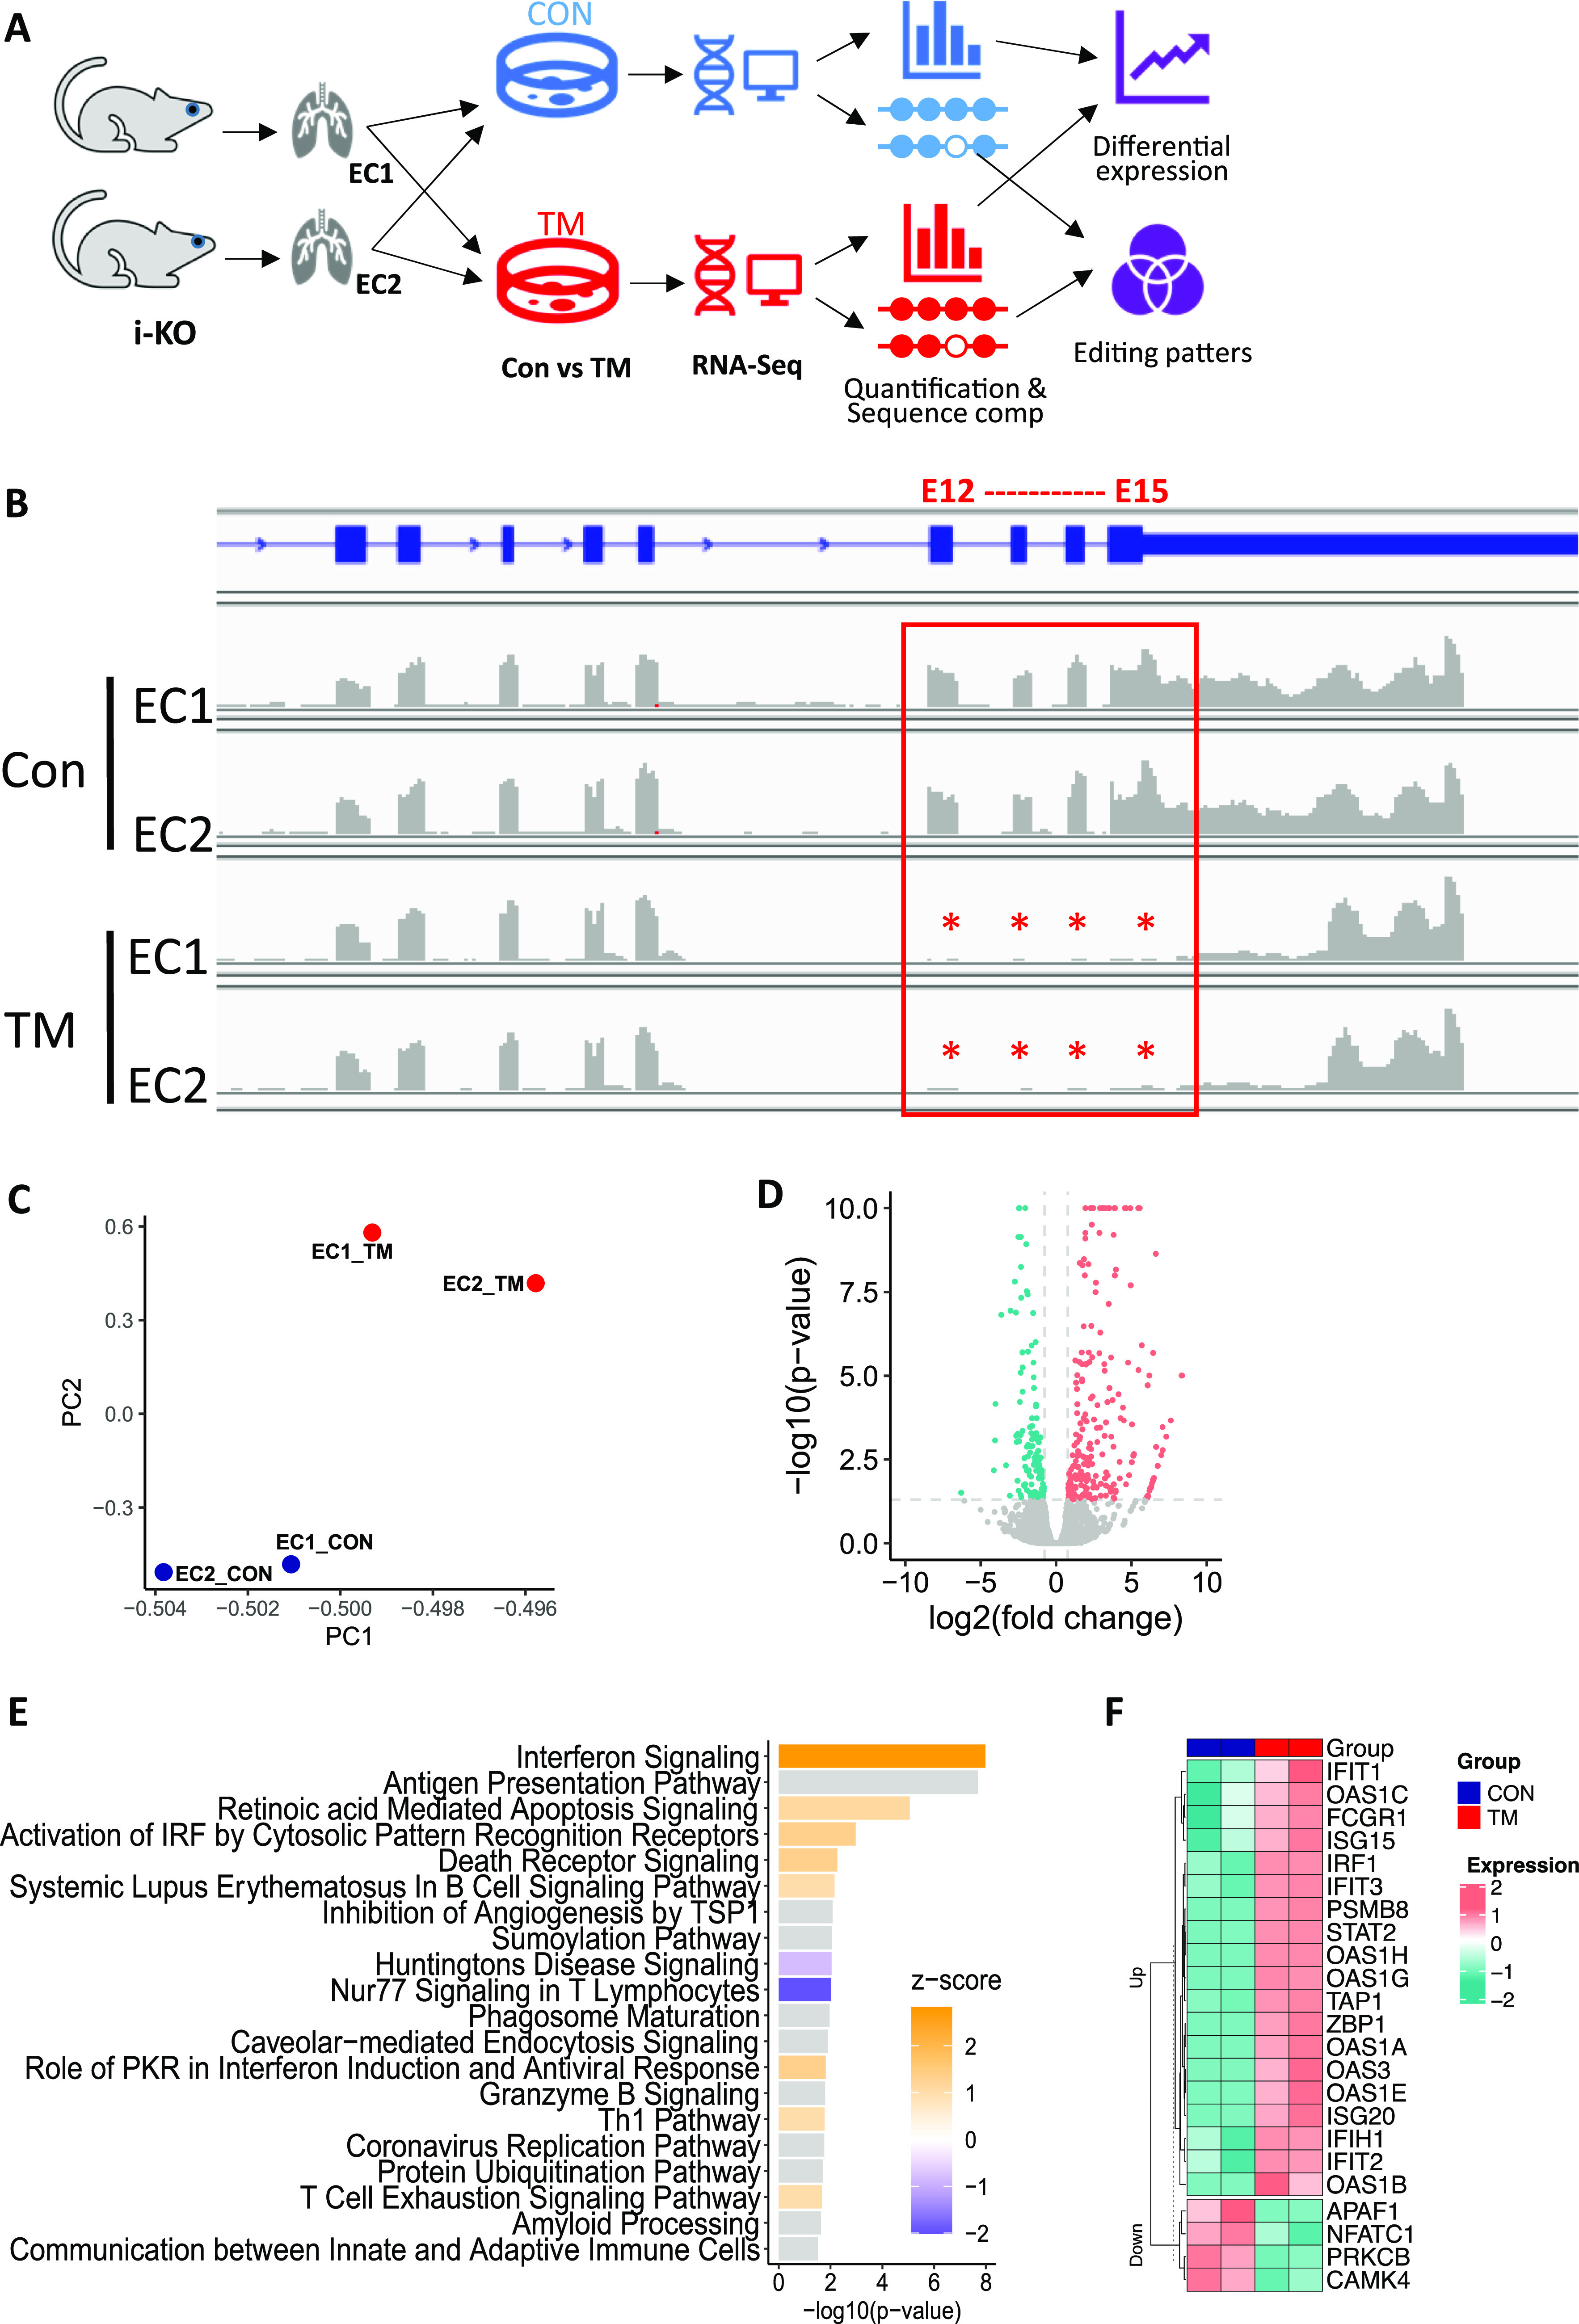
Figure 4. Genome-wide differential gene expression in control and ADAR1-deficient endothelial cells (ECs) via RNA-seq analysis.

(A) RNA analysis pipeline showing that tamoxifen (TM)-treated and non-treated ECs from two independent ADAR1 i-KO mice were used for analysis. (B) ADAR1 deletion of exon 12–15 in TM-treated ECs was confirmed by RNA read alignment. (C) Principal component analysis shows that cells from two independent mice were grouped by cell treatment. Blue: control samples; red: TM-treated samples. (D) Gene expression analysis illustrated by volcano plot showing the differentially expressed genes. Red: up-regulated genes; green: down-regulated genes. (E) Top significant pathways detected by Ingenuity Pathway Analysis based on the differentially expressed genes. Positive Z-score (orange) indicates activation, and negative score (blue) represents inhibition. (F) Heat map for the differentially expressed genes involved in the interferon signaling pathway.
