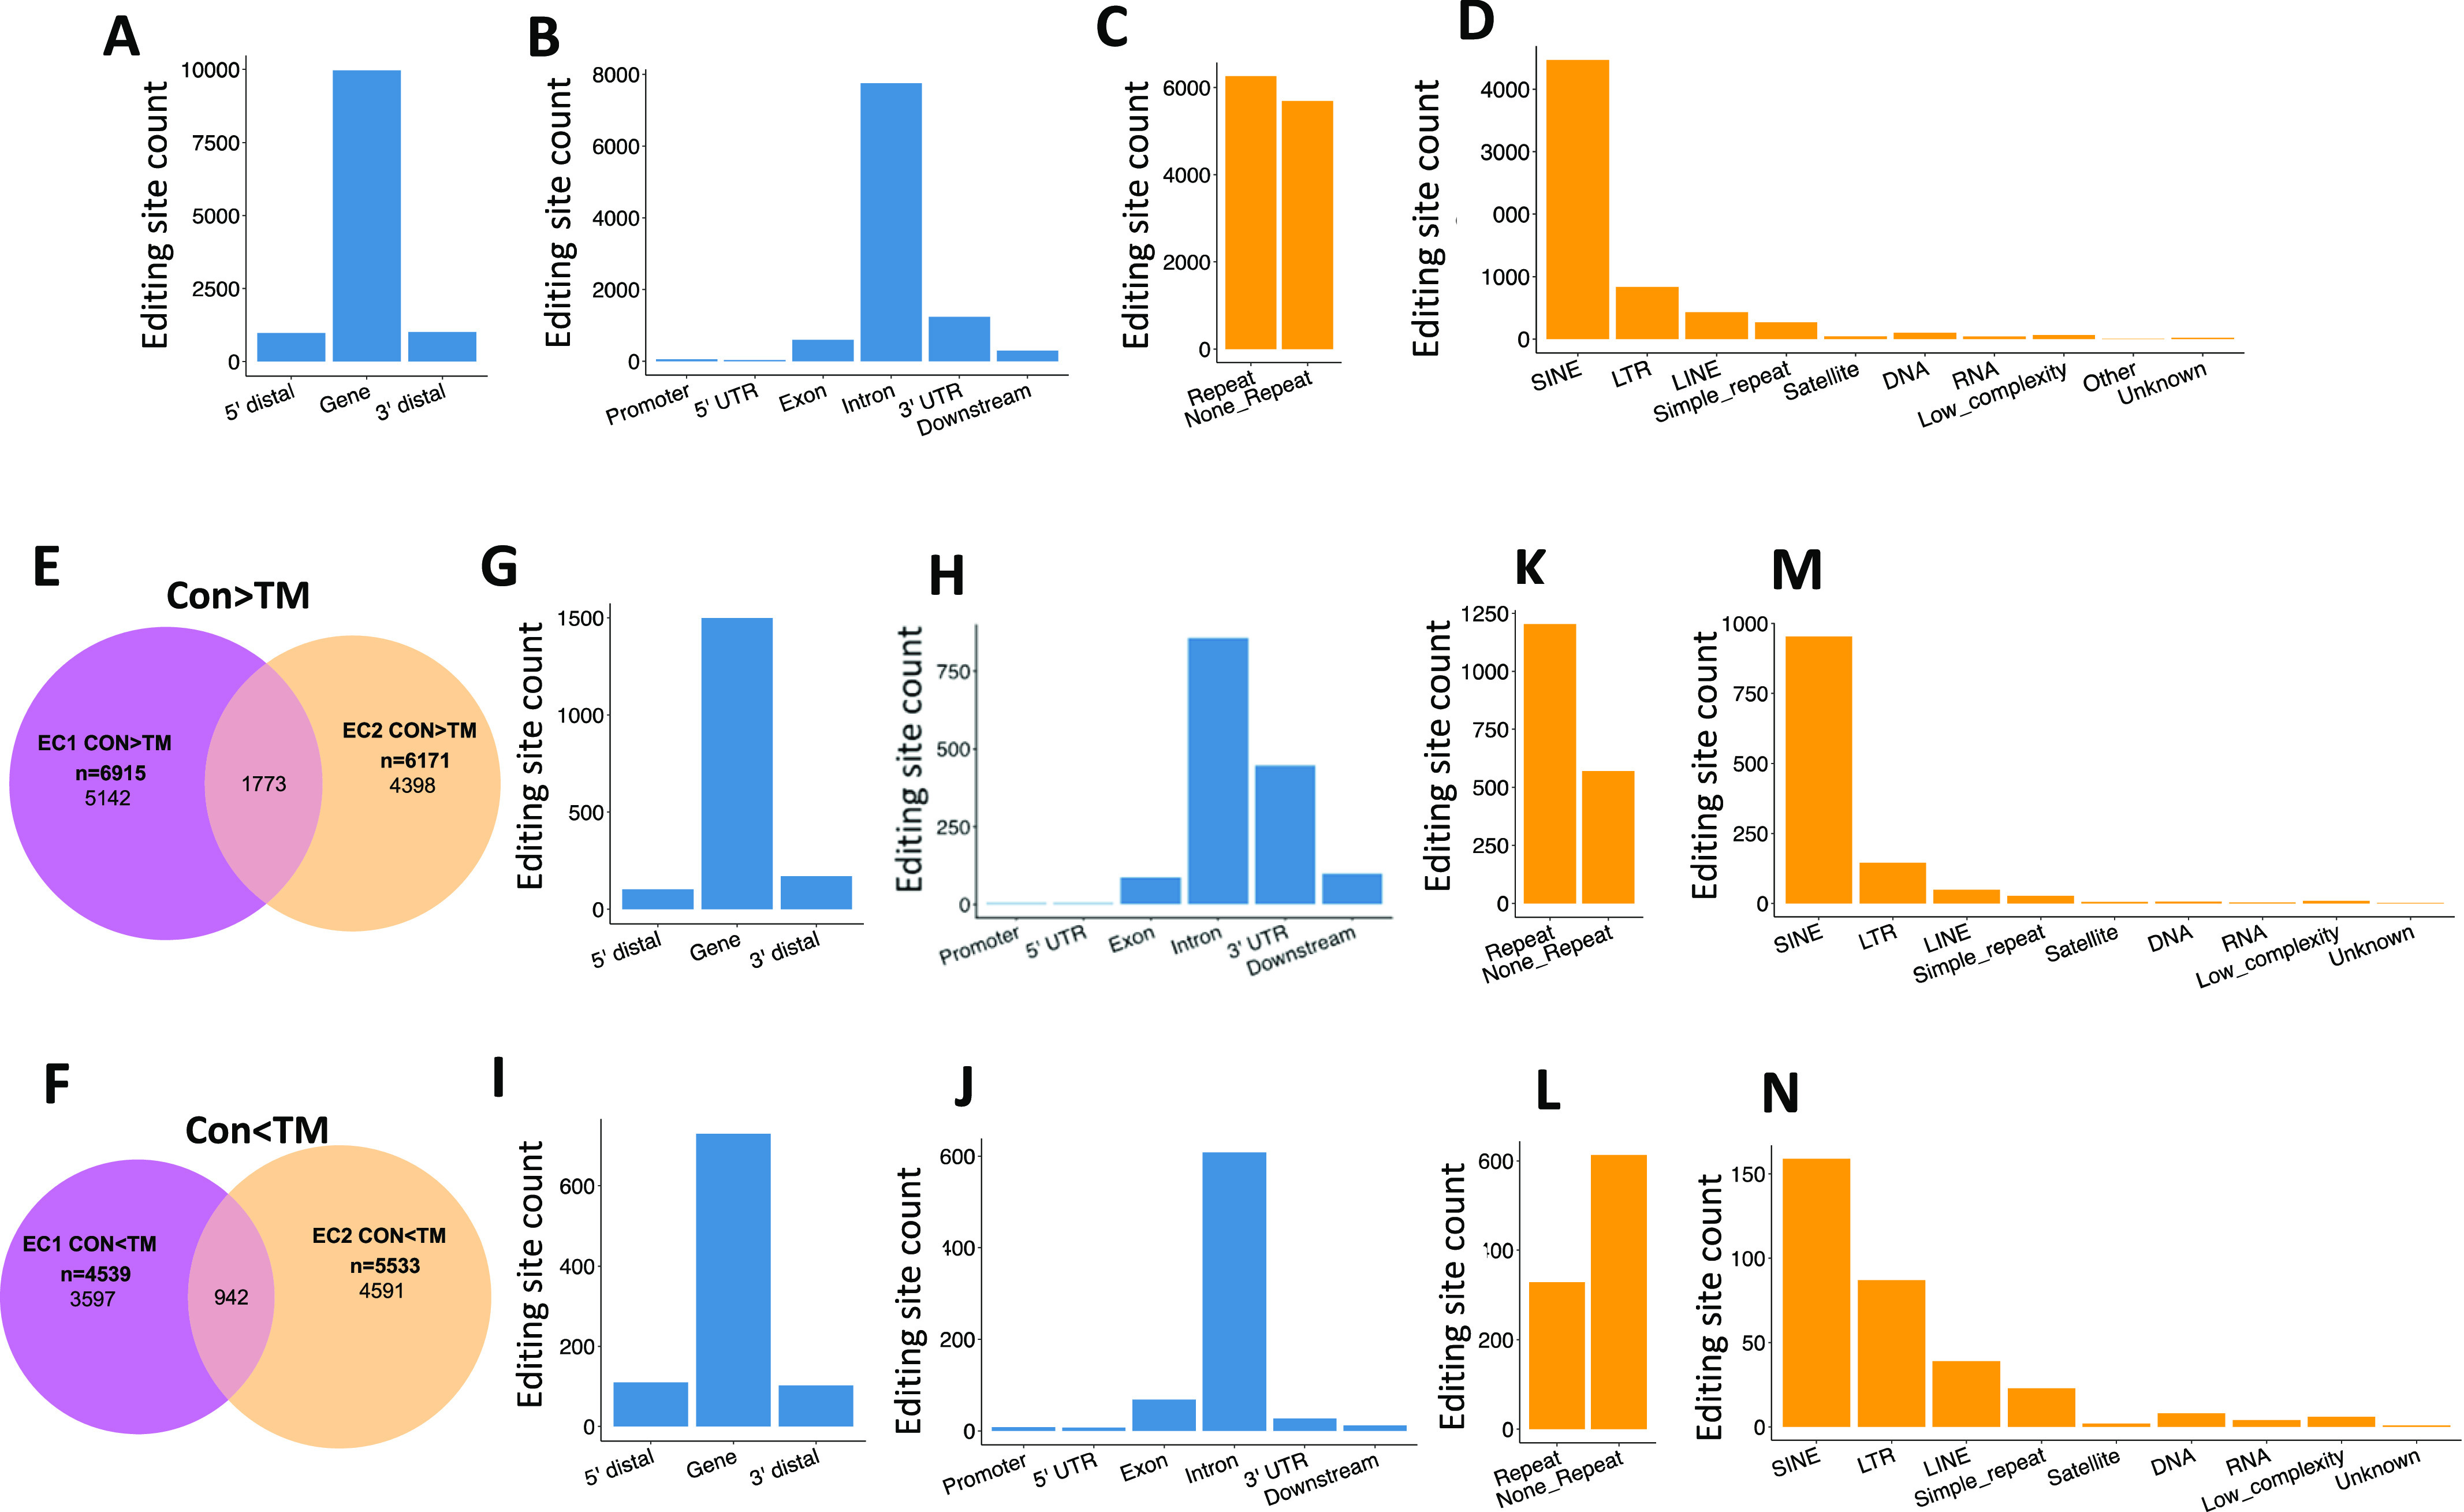
Figure 6. Distribution of RNA editing sites in endothelial cells (ECs).

Extensive RNA editing was identified in EC RNA transcripts by RNA sequence analysis. (A, B) show that most editing sites fell into gene regions, especially intron and 3′ untranslated regions. (C, D) show that about half of the editing sites were located in repetitive regions, with most of them falling in short interspersed nuclear element, long terminal repeat, and long interspersed nuclear element. (A, B, C, D) are the results of control (CON) ECs of the first mouse. (E) Venn diagram showing overlap between EC1 and EC2 for the CON > TM editing sites. (F) Venn diagram showing the overlap between EC1 and EC2 for the CON < TM editing sites. (G, H) Gene distribution of the common CON > TM editing sites in EC1 and EC2. (I, J) Gene distribution of the common CON < TM editing sites in EC1 and EC2. (K, L) Distribution of the EC1 and EC2 common editing sites with CON > TM and CON < TM, respectively, in repeat and non-repeat gene regions. (M, N) Distribution of the EC1 and EC2 common editing sites with CON > TM and CON < TM, respectively, in subcategories of repetitive regions. Panel (E, G, H, K, M) are the EC1 and EC2 common editing sites with CON > TM editing rate. Panel (F, I, J, L, N) are the EC1 and EC2 common editing sites with CON < TM editing rate.
