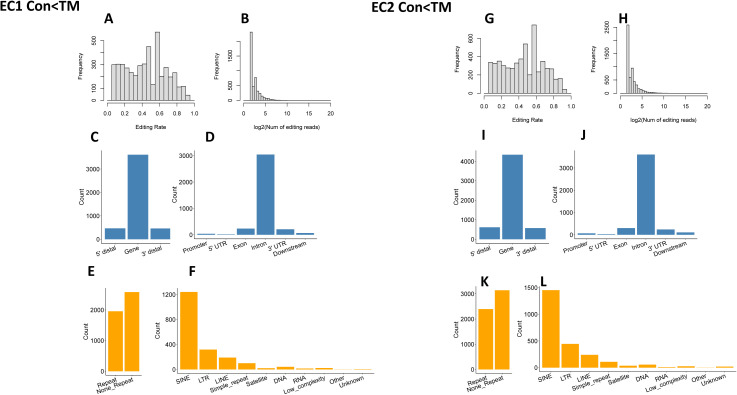
Figure S5. Low editing site distribution.
(A, B, C, D, E, F) Distribution of EC1 editing sites with lower editing rate in control (CON) samples. (A, B) Distribution of editing rate and editing read for EC1 CON < TM. (C, D) Gene distribution of editing sites for EC1 CON < TM. (E, F) Repetitive region distribution of editing sites for EC1 CON < TM. (G, H, I, J, K, L) Distribution of EC2 editing sites with higher editing rate in CON samples. (G, H) Distribution of editing rate and editing read for EC2 CON < TM. (I, J) Gene distribution of editing sites for EC2 CON < TM. (K, L) Repetitive region distribution of editing sites for EC2 CON < TM.

