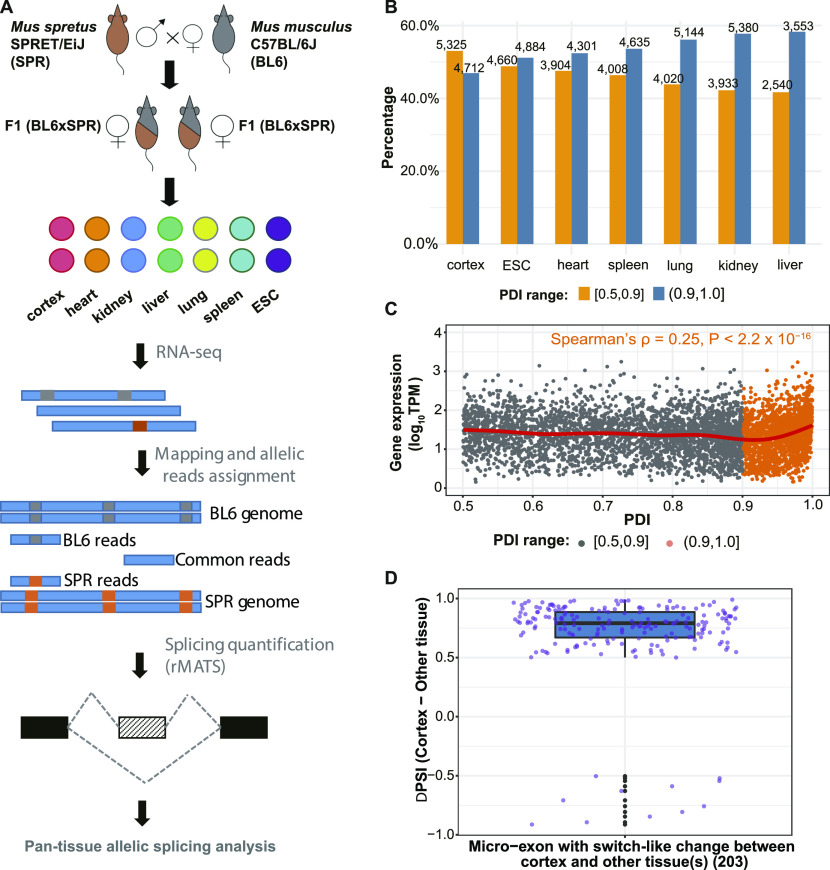
Figure 1. Quantification of alternative splicing patterns and diversity within and across tissues.
(A) Scheme of experimental design. (B) Proportion of high percent dominant isoform (PDI) (PDI > 0.9) and low PDI (PDI ≤ 0.9) SE events within each tissue. Numbers on the top of bars indicate the number of events in corresponding categories. (C) Correlation of PDI of SE event and gene expression of the corresponding gene in cerebral cortex. (B) Events are classified into two groups based on PDI values as in (B). The regression line (red) is fitted with a generalized additive model. See also Tables S1–S4. (D) 203 micro-exons exhibit Switch-Like changes between cerebral cortex and other tissue(s). The percent spliced in difference between cerebral cortex and other tissues (cortex–most different tissue) reveals higher inclusion levels in cerebral cortex than in other tissues. Box plot elements: center line, median; box limits, lower and upper quartiles; whiskers, lowest, and highest value within 1.5 IQR.

