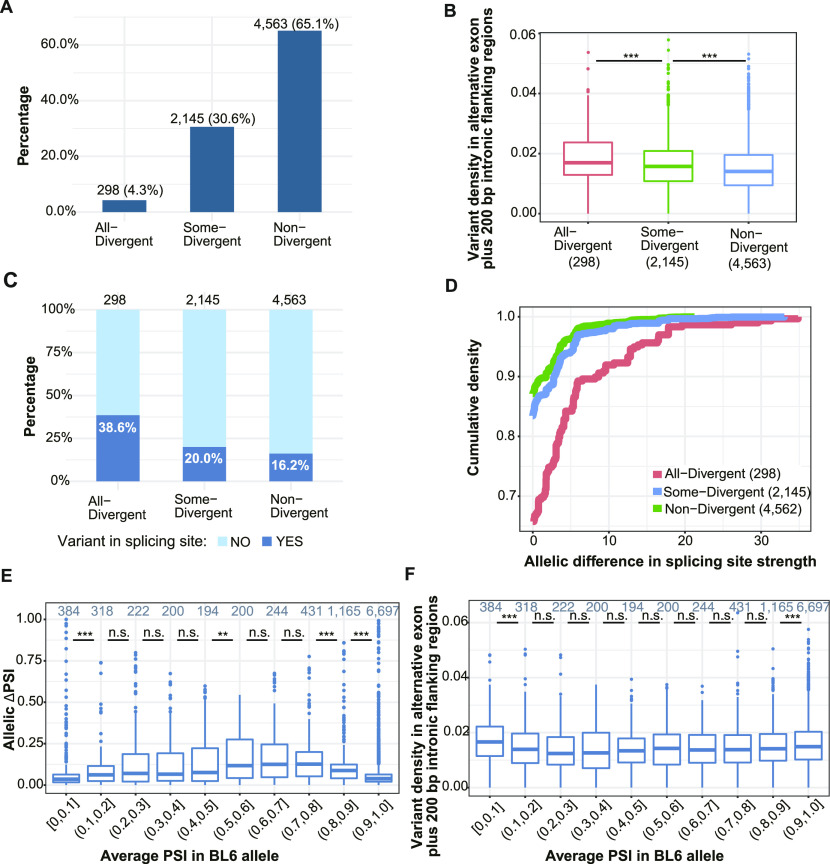
Figure 2. Cis-regulatory sequence variants and scaling law affect allelic splicing divergence.
(A) Classification of events expressed in two or more tissues into three groups based on allelic divergence across tissues. Numbers on the top of bars denote the count and percentage of events in corresponding groups. (B) Distribution of variant density in each divergence group. Variants in the alternative exon plus its intronic flanking regions (200 bp on both sides) were counted and divided by the total length of the region. Numbers in parentheses denote the numbers of events in corresponding groups (Two-sided Wilcoxon rank-sum test). (C) Percentage of SE events with (steel blue) or without (light sky blue) variants in splicing sites. Only the 5′ and 3′ splicing site of the alternative exon are considered. Numbers on the top of the bars indicate the total number of events within the corresponding groups (Fisher’s exact test). (D) Cumulative distributions of the absolute difference between predicted scores for splicing site strengths of C57BL/6J (BL6) and SPRET/EiJ (SPR). Scores of the 5′ and 3′ splicing sites were summed up for each alternative exon. (E) Scaling law for allelic splicing divergence. The average BL6 percent spliced in (PSI) across tissues is treated as starting PSI, and the |ΔPSI| (y-axis) between SPR and BL6 is compared between different ranges of starting PSI (x-axis). Numbers on the top of boxes indicate the number of events in corresponding PSI ranges (one-sided Wilcoxon rank-sum test). (F) Distribution of variant density in alternative exon and its flanking introns (200 bp on both sides) for events in different PSI ranges. (E) The 10 bins of PSI are based on the average PSI of the BL6 allele across expressing tissues (starting allele in E). Boxplots show the Q1 to Q3 quartile values (the box limits), the median (the horizontal lines), and values within the 1.5 * IQR (the whiskers). n.s., not significant; *P < 0.05; **P < 0.01; ***P < 0.001.

