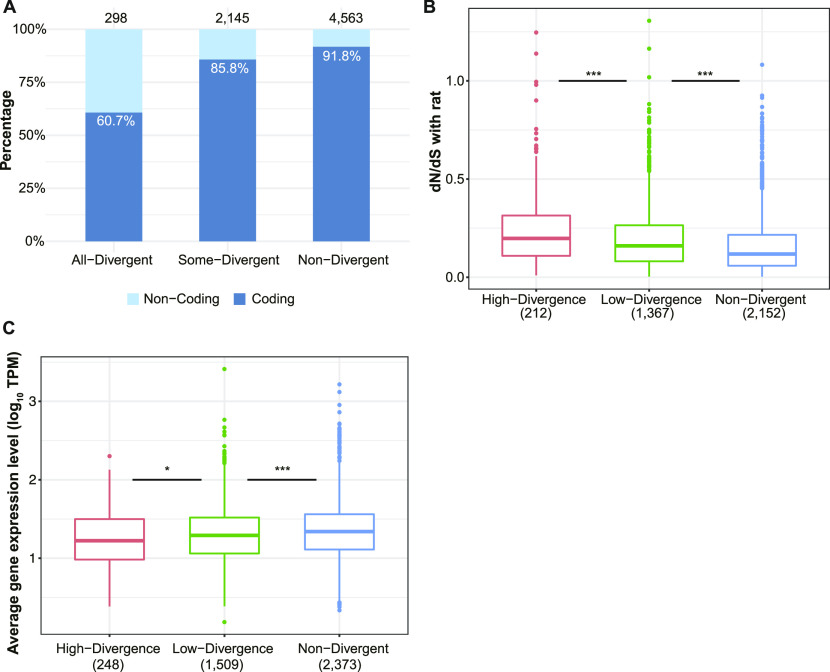
Figure 3. Genes under relaxed selective constraints exhibit more divergence in alternative splicing.
(A) Proportion of coding (steel blue) and non-coding (light sky blue) alternative exons in the three divergence groups. The percentage of coding alternative exons in each group is indicated within the corresponding bar, and numbers on the top of bars denote total numbers of events in the corresponding groups. (B) Comparison of dN/dS ratios of genes belonging to different divergence groups (indicated by different colors) based on splicing divergence score score (see the Materials and Methods section). Numbers in parentheses indicate the number of genes within corresponding groups (one-sided Wilcoxon rank-sum test). (C) Comparison of average gene expression level among the three divergence groups. Numbers in parentheses indicate the number of genes within corresponding groups (one-sided Wilcoxon rank-sum test).

