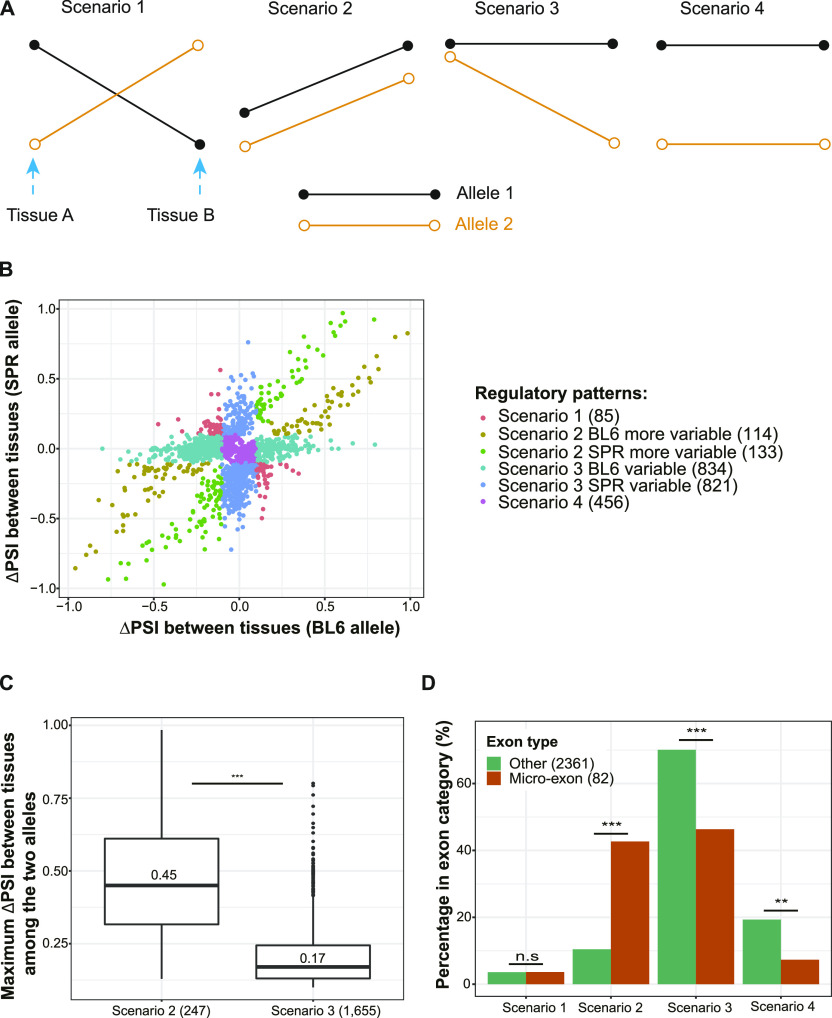
Figure 5. Patterns of tissue-dependent allelic splicing divergence.
(A) Scheme illustrating the four scenarios. Each segment indicates the pattern of splicing change of one allele between tissues and the two alleles are indicated with two different colors. (B) Allele-specific tissue-regulatory patterns. The x-axis presents the percent spliced in (PSI) difference of the C57BL/6J (BL6) allele between the two tissues with maximal difference in allelic ΔPSI, and the y-axis presents the corresponding information for the SPRET/EiJ (SPR) allele. (C) Scenario 2 holds higher PSI difference between tissues than Scenario 3. The maximum between-tissue PSI differences of the two alleles are compared among the four scenarios. Median value of the ΔPSIT in each scenario is indicated in the box, and numbers in parentheses represent the numbers of events belonging to the corresponding scenarios. One-sided Wilcoxon rank-sum test was used to test for significance. (D) Micro-exons are enriched in Scenario 2 and less likely to be in Scenario 3 or 4. The bar plot shows the percentage of each scenario compared between micro-exons (dark orange) and other exons (forest green). Fisher’s exact test was used to test for significance. n.s., not significant; *P < 0.05; **P < 0.01; ***P < 0.001.

