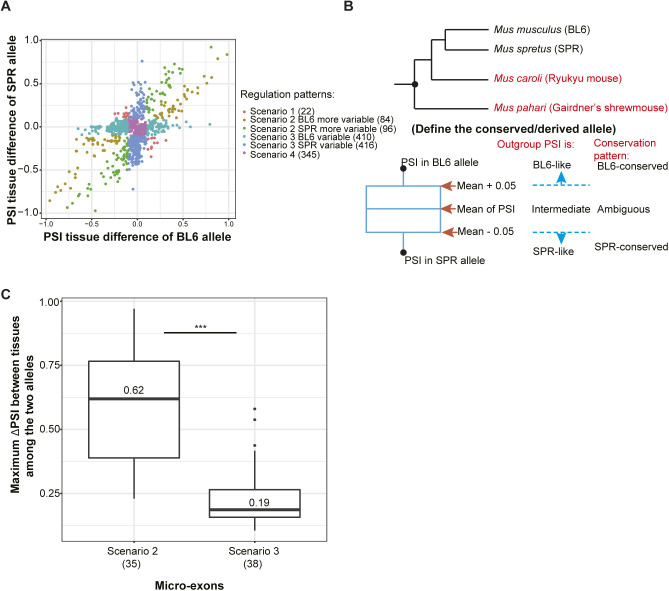
Figure S10. Tissue-regulatory patterns of splicing divergence in four selected tissues (cortex, heart, kidney, and liver).
(A) Tissue-regulatory patterns of splicing divergence in four selected tissues. The x-axis presents the ΔPSI of the C57BL/6J (BL6) allele between the two tissues with maximal difference in allelic ΔPSI, and the y-axis presents the corresponding information for the SPRET/EiJ (SPR) allele. (B) Definition of the conserved allele by using two out-groups (Mus caroli and Mus pahari). (C) Micro-exon events in Scenario 2 have larger PSI differences between tissues than those falling in Scenario 3. The magnitude of the difference is even bigger than the difference between the two scenarios in all exons. The y-axis represents the maximum of {∆PSI between tissues of the BL6 allele, ∆PSI between tissues of the SPR allele}. The median value of the ∆PSI in each scenario is indicated in the box, and numbers in parentheses represent the numbers of events belonging to the corresponding scenarios. One-sided Wilcoxon rank-sum test was used to test for significance. Box plot elements: center line, median; box limits, lower and upper quartiles; whiskers, lowest and highest value within 1.5 IQR. n.s., not significant; *P < 0.05; **P < 0.01; ***P < 0.001.

