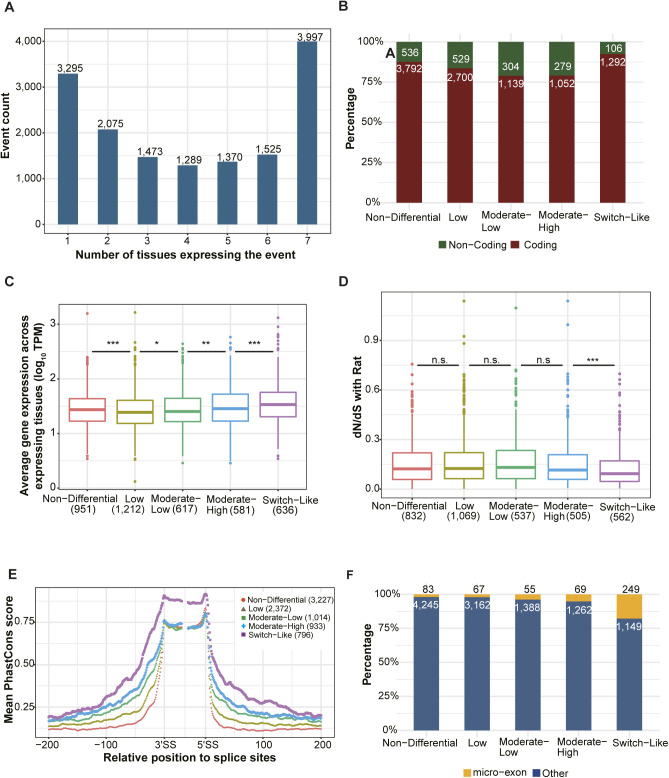
Figure S2. Switch-Like events show potentially functional importance.
(A) Statistics of events expressed in different numbers of tissues. Numbers on the top of bars indicate the total number of events in corresponding categories. (B, C, D, E) Among the 11,729 events expressed in two or more tissues, 4,328 were classified as “Non-Differential” (switch score < 0.1), 3,229 as “Low” (0.1 ≤ switch score < 0.2), 1,443 as “Moderate-Low” (0.2 ≤ switch score < 0.3), 1,331 as “Moderate-High” (0.3 ≤ switch score < 0.5) and 1,398 as “Switch-Like” (switch score > 0.5). According to the error hypothesis, we would expect that genes with higher switch scores have lower expression levels and higher dN/dS ratios than those with smaller differences. However, we found patterns resembling U-shaped or hump-shaped distributions: “Non-Differential” and “Switch-Like” events both affect coding regions more often than events with “Moderate-Low” or “Moderate-High” switch scores (B; numbers in each bar denote the number of coding and non-coding SE events in the corresponding group). (C, D) Furthermore, the genes harboring events in either of these categories have higher expression levels (C) and those with “Switch-Like” events also have significantly lower dN/dS ratios than those with events in the “Low” and “Moderate-Low” categories (D). Importantly, the flanking regions of “Switch-Like” events also are more conserved (with higher PhastCons scores) than those of events in all three intermediate categories. (E) Events expressed in two or more tissues and with exon size ≥60 bp and intron size ≥200 bp were used. The mean PhastCons score of each position across events within the same tissue-regulatory group for exonic regions (including 30 bp at both 5′ and 3′ end of alternative exon) and intronic regions (200 bp flanking sequences on each side) around alternative splicing sites was compared between Switch-Like events and the other four tissue-regulatory groups. (F) Enrichment of micro-exons in Switch-Like events. Events expressed in two or more tissues are considered. Percentages of micro-exons (exons with length ≤ 30 bp) and regular exons are indicated for the five tissue-regulatory groups. Numbers within and on top of bars denote the number of regular exons and micro-exons in each group, respectively. (B, C) One-sided Wilcoxon rank-sum test was used in (B) and (C). Box plot elements: boxes span values from the first (Q1) to the third (Q3) quartile, with a horizontal line indicating the median (Q2). The whiskers extend from the edges of the box to the points representing the largest and smallest observed values within the 1.5 * IQR (interquartile range = Q3 − Q1) from the edges of the box. Outlier values are plotted as dots outside the whiskers. n.s. not significant; *P < 0.05; **P < 0.01; ***P < 0.001.

