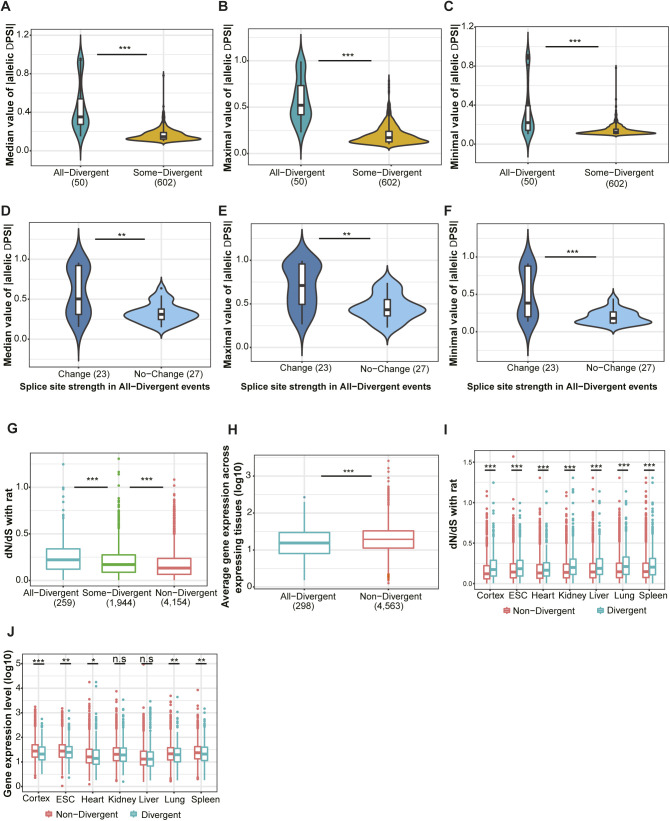
Figure S3. All-Divergent events have higher magnitude of ΔPSI between alleles; allelic divergence primarily affects genes under relaxed selective constraints.
(A, B, C) Median, maximum, and minimum of absolute ΔPSI across divergent tissues are compared between All-Divergent (steel blue) and Some-Divergent (golden yellow) events (one-sided Wilcoxon rank-sum test). (D, E, F) Comparing median, maximum, and minimum of absolute ΔPSI between events in All-Divergent with (deep sky blue) and without (light sky blue) splice site change (one-sided Wilcoxon rank-sum test). (G) dN/dS ratios of genes associated with SE events belonging to different divergence groups (indicated by different colors). Events expressed in two to seven tissues whose associated genes have orthologs in rat are used (one-sided Wilcoxon rank-sum test). (H) Genes associated with “All-Divergent” events have lower expression levels than those associated with “Non-Divergent” events (one-sided Wilcoxon rank-sum test). Events expressed in two to seven tissues are used. (I) Comparison of dN/dS ratio between genes associated with divergent events (cyan) and those associated with non-divergent events (red) in each individual tissue (one-sided Wilcoxon rank-sum test). (J) Comparison of gene expression level between genes associated with divergent and those associated with non-divergent events in each tissue (one-sided Wilcoxon rank-sum test). Box plot elements: center line, median; box limits, lower and upper quartiles; whiskers, lowest and highest value within 1.5 IQR. n.s., not significant; *P < 0.05; **P < 0.01; ***P < 0.001.

