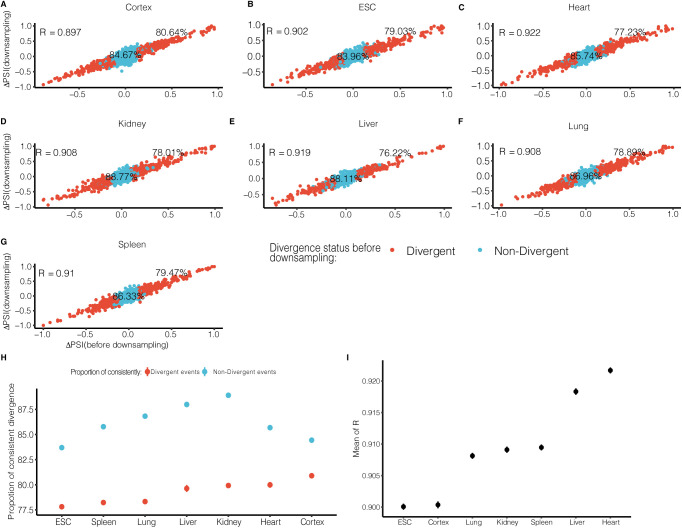
Figure S4. Comparing splicing divergence patterns between down-sampled dataset and original dataset.
(A, B, C, D, E, F, G) We down-sampled junction reads of each event in either allele across all samples to the same level of 20 reads, and determined divergent and non-divergent splicing based on percent spliced in (PSI) difference (divergent: ΔPSI ≥ 0.1). The x-axis and y-axis denote PSI difference before down-sampling and after down-sampling, respectively. The colors distinguish “Divergent” (red) and “Non-Divergent” (light blue) in the original dataset. The proportions of consistent classification of “Divergent” events and “Non-Divergent” events between down-sampled (use PSI difference of 0.1 as cutoff) and original datasets have been labeled near the corresponding points. (H) The mean and 95% confidence interval (calculated by down-sampling for 100 times) of proportions of consistent classification of “Divergent” events (red) and “Non-Divergent” events (blue) between down-sampled and original datasets. (I) The mean and 95% confidence interval (calculated by down-sampling for 100 times) of Pearson’s correlation coefficient (R) of PSI divergence between down-sampled and original datasets.

