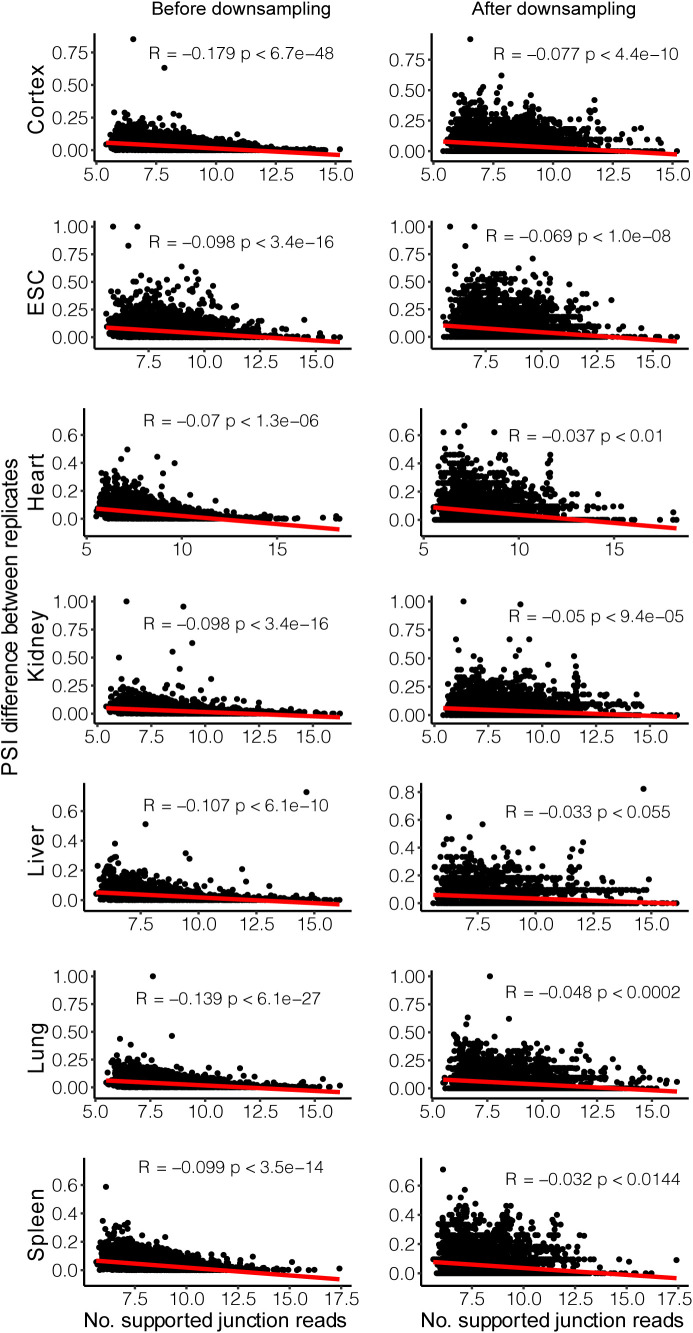
Figure S8. Relationship between total junction reads and percent spliced in (PSI) difference between biological replicates.
The left panel shows the relationship between total reads count (all junction reads, log2 transformed) and PSI difference between replicates based on the original dataset. The right panel shows the relationship between original read count (log2 transformed) and PSI difference estimated based on the down-sampled dataset. The red line in each scatter plot was fitted by linear regression. Pearson’s correlation coefficient (R) and P-value are presented for each subfigure.

