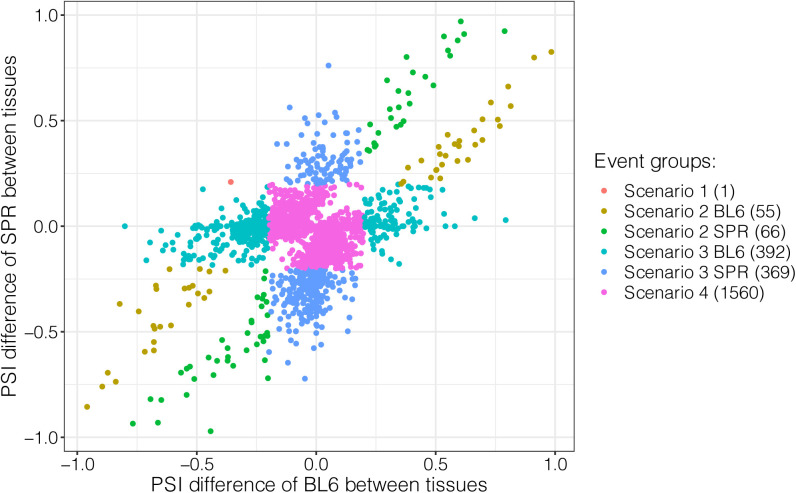
Figure S9. Classification of the four scenarios with more stringent percent spliced in difference threshold (0.2).
We changed the threshold of 0.1 as in Fig 5B to 0.2, and the number of events in “Scenario 3” (761) is still much higher than that in “Scenario 1” (1) and “Scenario 2” (121).

