
FIGURE 1.
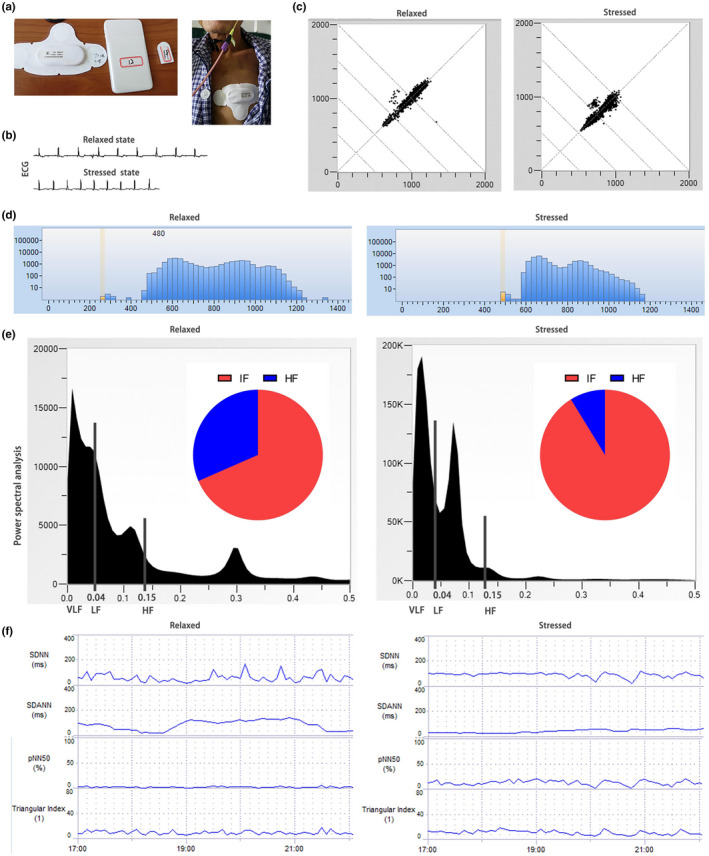
Heart rate variability (HRV) in a relaxed state and under severe mental stressed state. (a) A smart monitoring device for the collection of HRV data; (b) ECG manifestations in relaxed and stressed state; (c) Poincaré scatter diagram in a relaxed and stressed state; (d) Histogram indicates the difference between relaxed and stressed state; (e) Power spectral density analysis of frequency‐domain analysis indicates the difference between relaxed and stressed state, including power of VLF spectrum (<0.04 Hz in frequency band), power of LF spectrum (0.04–0.15 Hz in frequency band), power of HF spectrum (0.15–0.40 Hz in frequency band), and the ratio of LF to HF (LF/HF); (f) Trend chart of time‐domain parameters indicate the difference between relaxed and stressed state. HF, high‐frequency power; LF, low‐frequency power