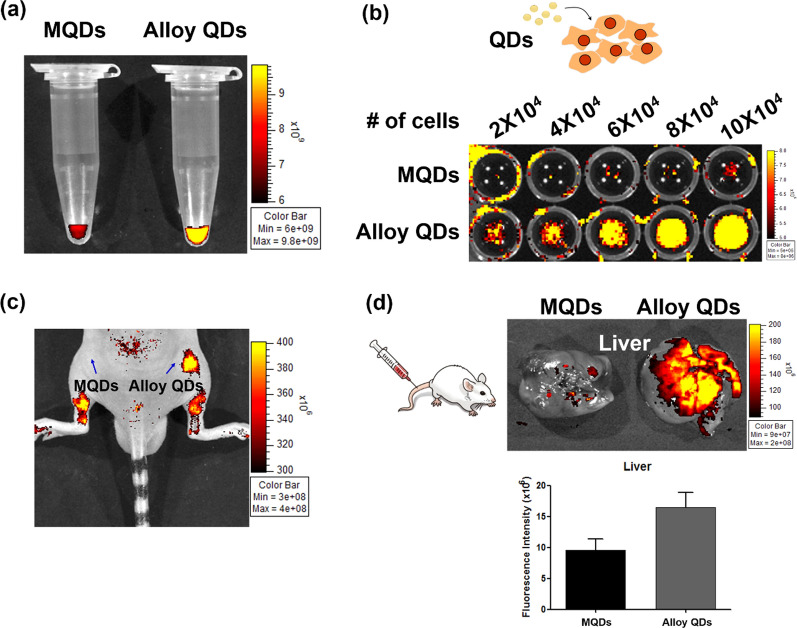
Fig. 4.
In vivo fluorescence imaging of sensitive alloy QDs. a Measured fluorescence intensity of the same amount of MQDs and alloy QDs measured in a tube using an in vivo imaging device. Higher fluorescence signal from alloy QDs than that of MQDs seen in the tube. b MQDs or alloy QDs were internalized into HeLa cells, and a cell-number-dependent increase in the fluorescence signal was detected in the alloy QDs treated group. c The same concentration of MQDs and alloy QDs were subcutaneously injected into nude mice. d Fluorescence image obtained 1 h after the intravenous injection of MQDs or alloy QDs. The region of interest (ROI) was drawn in the liver tissue of each group

