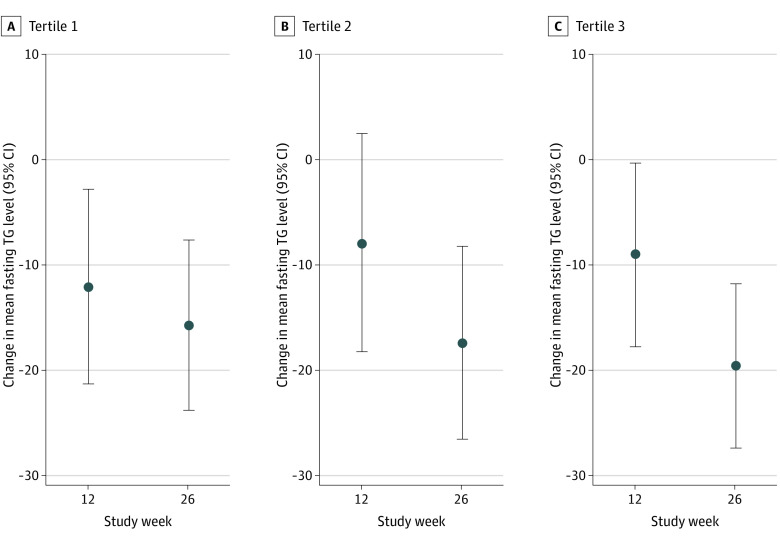
Figure 2. Percentage Change From Baseline in Fasting Triglyceride Levels According to Tertiles of Achieved Concentrations of Plasma Phospholipid Eicosapentaenoic Acid and Docosahexaenoic Acid.
Values are least-square mean differences from baseline (circles), with 95% CIs (error bars) from the analysis of covariance, including main effects of treatment; qualifying triglyceride (TG) category (≤750 vs >750 mg/dL); use of statin, cholesterol-absorption inhibitors, and/or proprotein convertase subtilisin/kexin type 9 serine protease inhibitors (yes or no); and baseline TG value as covariates. The ranges of achieved eicosapentaenoic acid plus docosahexaenoic acid concentrations in each tertile, assessed as percent of fatty acids, are as follows: T1, 1.2 to 2.4 (12 weeks) and 1.1 to 2.3 (26 weeks); T2, 2.5 to 3.6 (12 weeks) and 2.4 to 3.5 (26 weeks); T3, 3.7 to 9.0 (12 weeks) and 3.6 to 11.3 (26 weeks).

