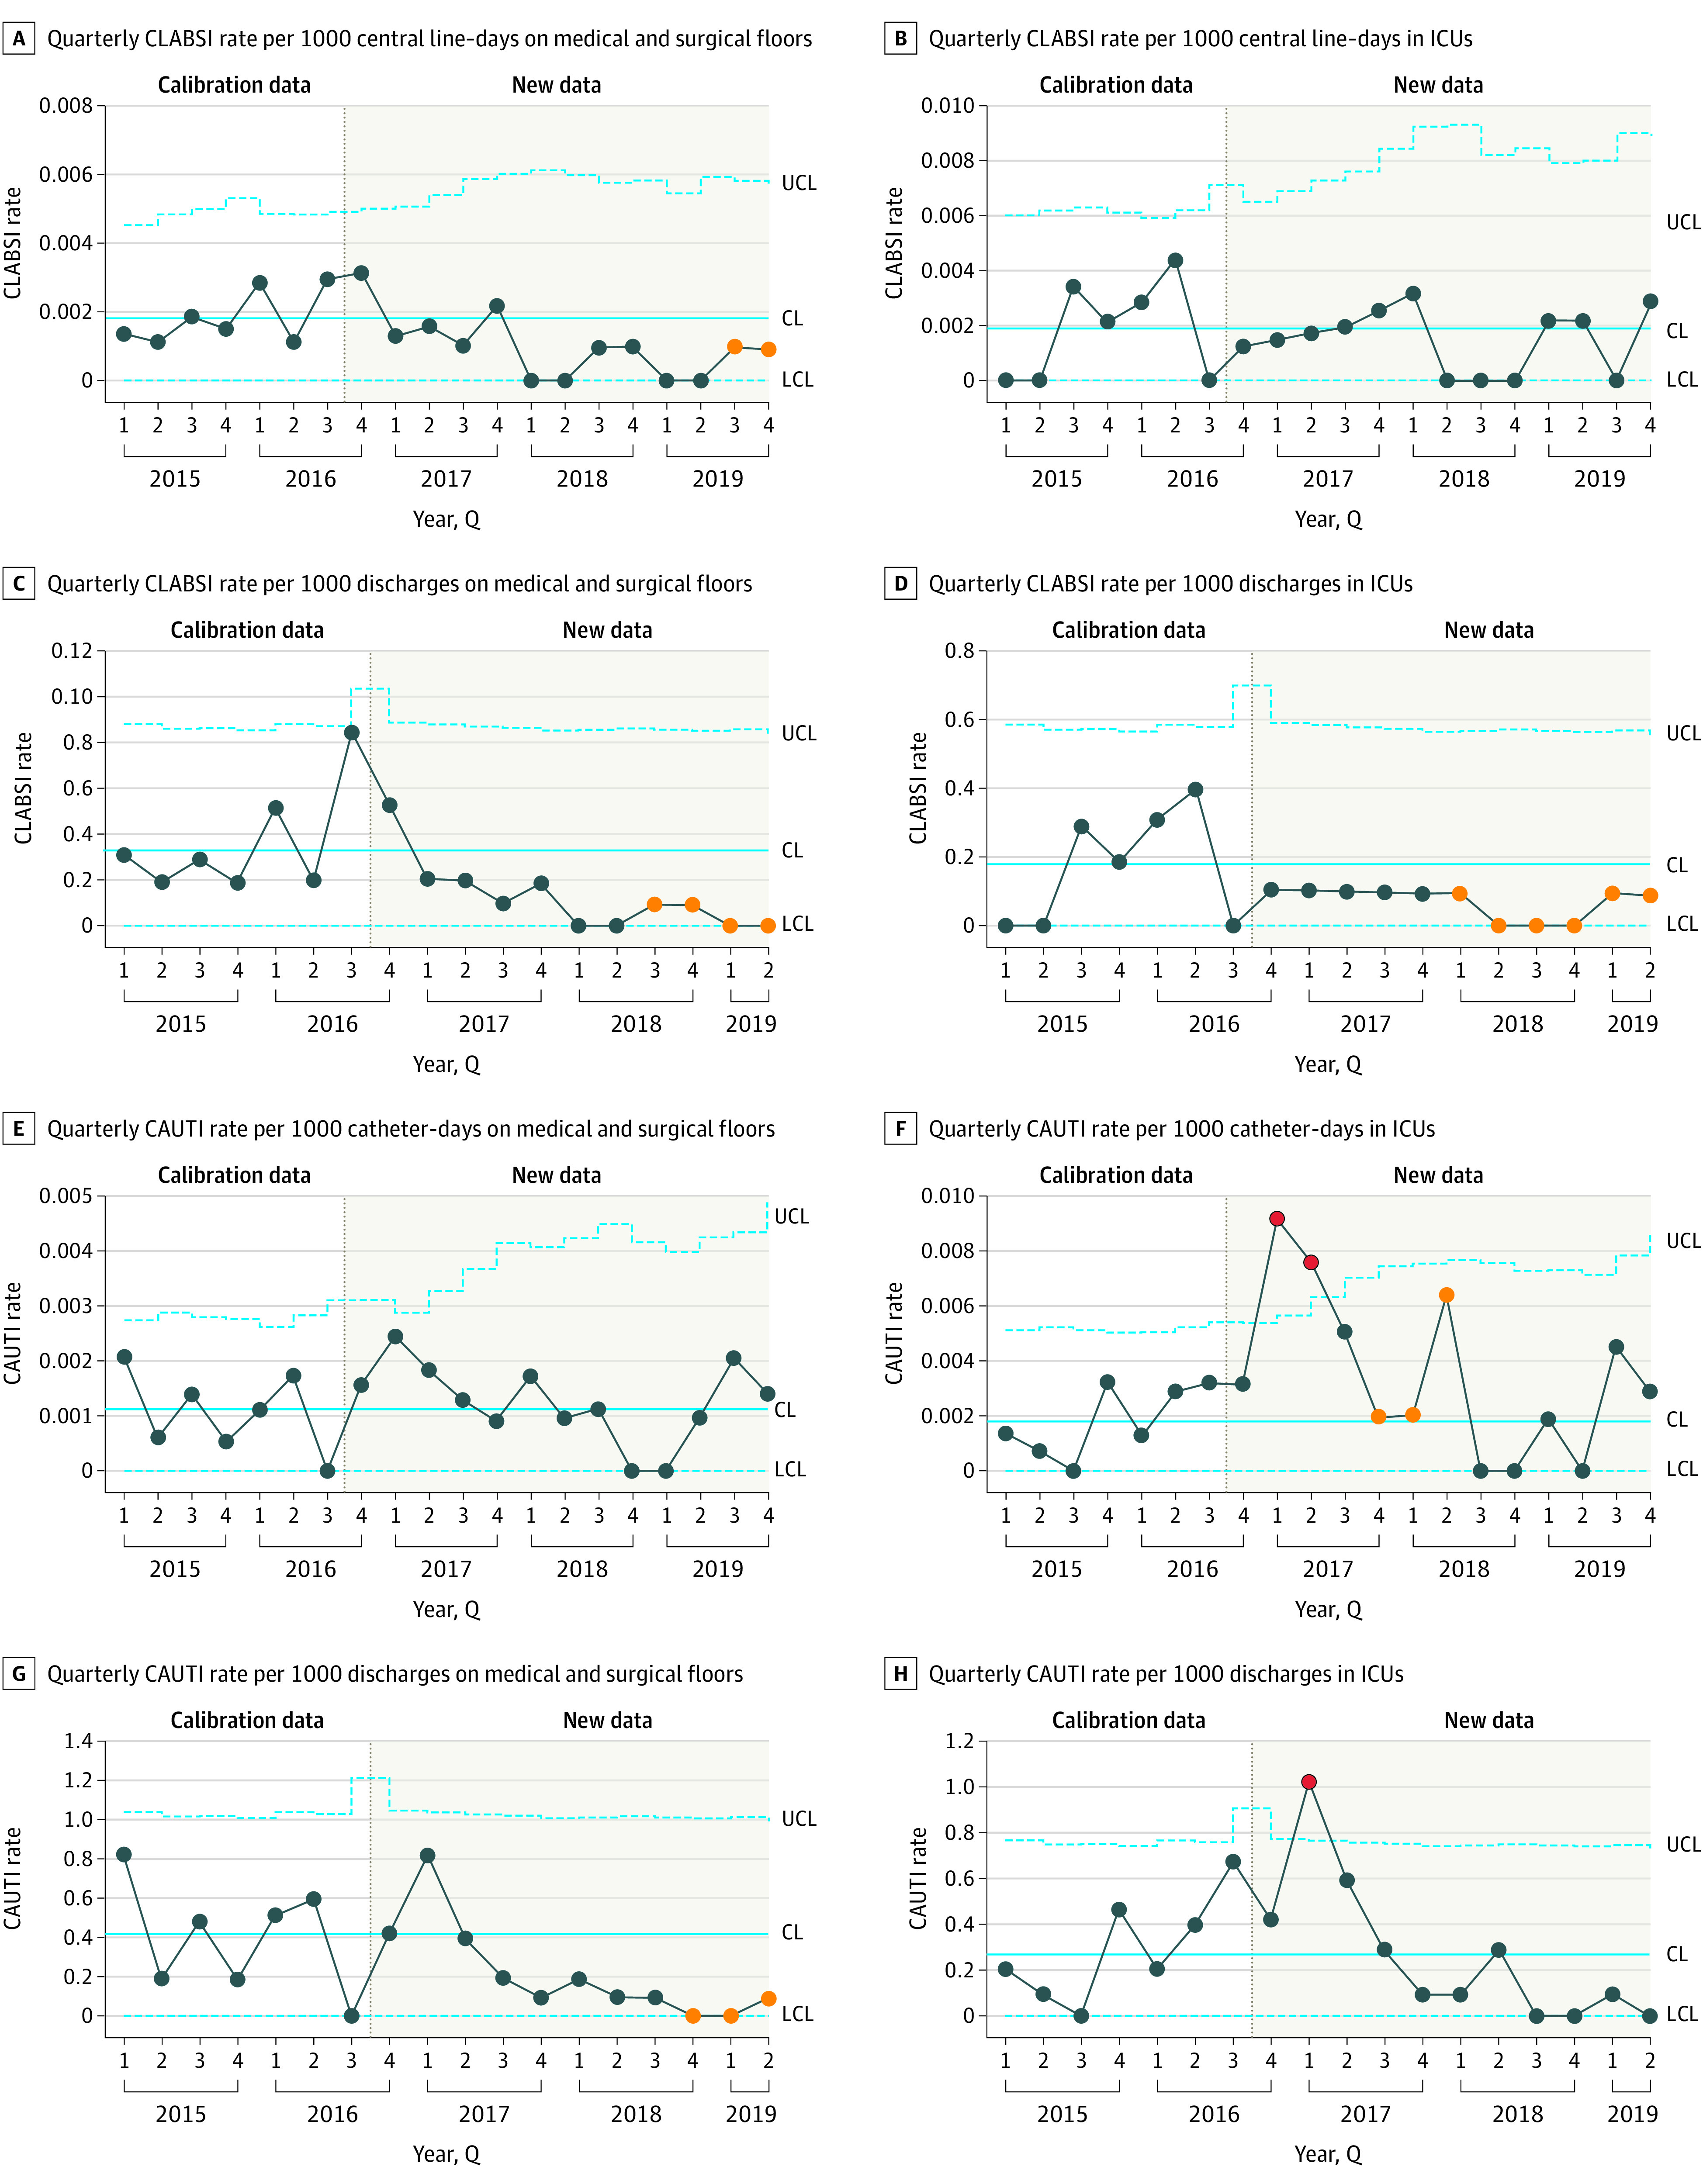
Figure 2. Statistical Process Control Charts of Central Line–Associated Bloodstream Infection (CLABSI) and Catheter-Associated Urinary Tract Infections (CAUTI) Metrics Pre- and Postmerger.

The upper and lower blue dotted confidence limits (UCL and LCL, respectively) denote bounds 3 SDs from the mean, indicated by the solid blue lines. The eighth consecutive point below or above the mean and all subsequent ones are indicated in orange. Points outside the 3-SD range are indicated in red.
