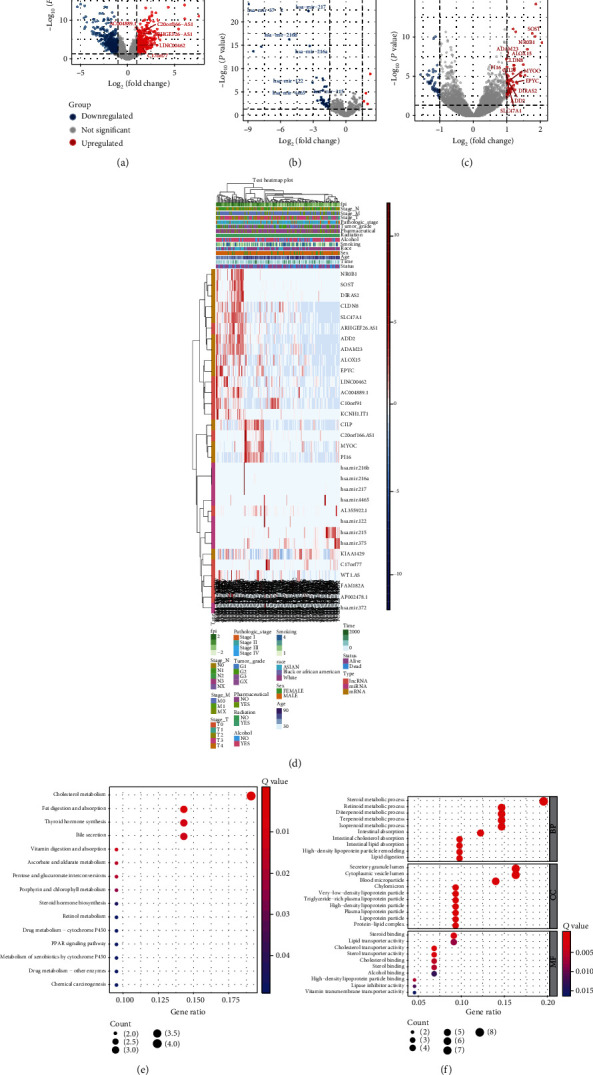
Figure 2.

Establishment of the ferroptosis index model and identification of FPI-associated differentially expressed genes. (a–c) Volcano plots showing the (a) DE-lncRNA, (b) DE-mRNA, and (c) DE-miRNA. (d) A heatmap of the key DE-lncRNA, DE-mRNA, and DE-miRNA. (e) KEGG pathway enrichment analysis and (f) GO function analysis of the DE-mRNA.
