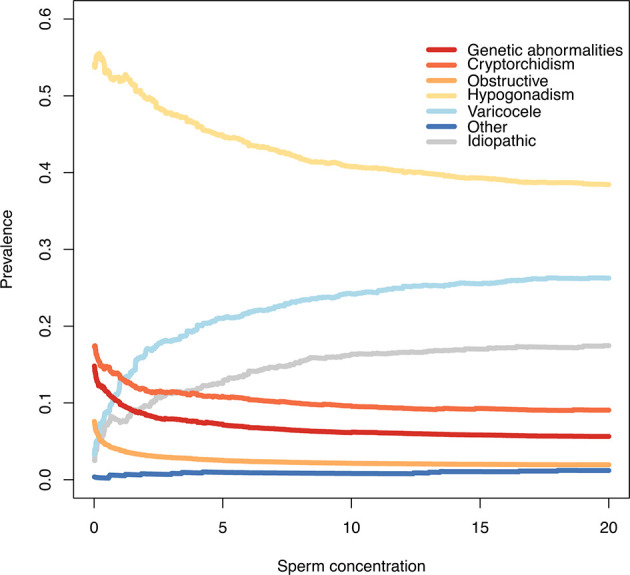
Figure 2.

Prevalence of different causes of male factor infertility according to different sperm concentration thresholds. At each sperm concentration threshold (x axis) is shown on the y-axis the relative proportion of men with a specific causal factor (eg: if x=5, on the y-axis is shown cause prevalence of men with sperm concentration < 5 million/ml).
