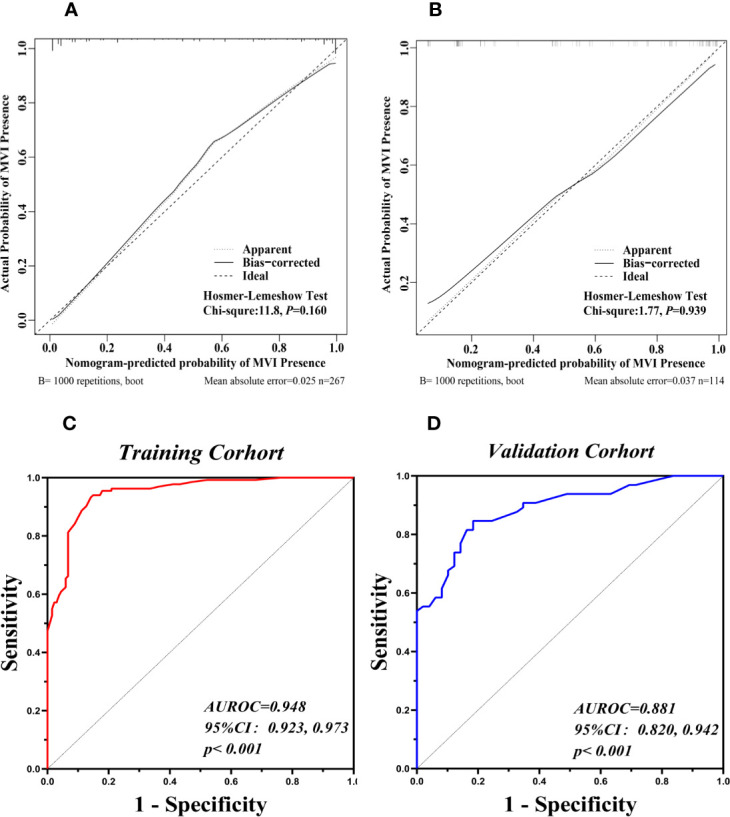
Figure 6.

Validation of the Nomograms for prediction of MVI. The calibration curves for predicting presence of MVI in the training cohort (A) and the validation cohort (B). Nomogram-predicted MVI presence was plotted on the X-axis, and the actual MVI presence was plotted on the Y-axis. A plot along the 45° line would indicate a perfect calibration model in which the predicted presence are identical to the actual presence. The apparent line represented the fitting line between the predicted situation of the model and the actual situation. The ROC curves of the nomogram in the training cohort (C, AUROC: 0.948) and the validation cohort (D, AUROC: 0.881).
