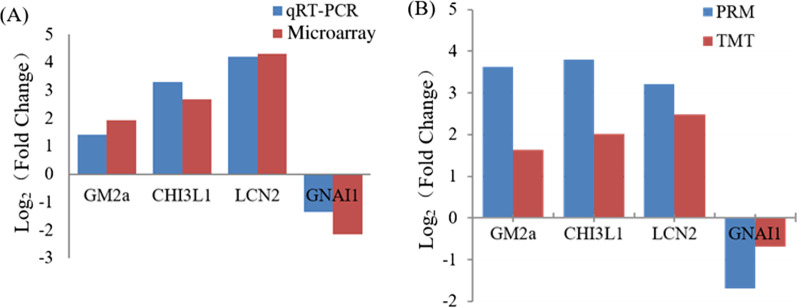
Fig. 6.
Data verified by RT-qPCR and PRM. A Comparison of the expressions of DEGs determined by microarray and qRT-PCR. log2 (Fold change) of the selected DEGs measured by microarray and qRT-PCR. GM2a: GM2 ganglioside activator; CHI3L1: Chitinase-3-like protein 1; LCN2: Neutrophil gelatinase-associated lipocalin; GNAI1: Guanine nucleotide-binding protein G(i) subunit alpha-1; The transcript expression levels of the selected genes were each normalized to that of the ACTB gene. B Comparison of the quantification results between TMT and PRM. log2 (Fold change) of the DEPS were measured by TMT and PRM

