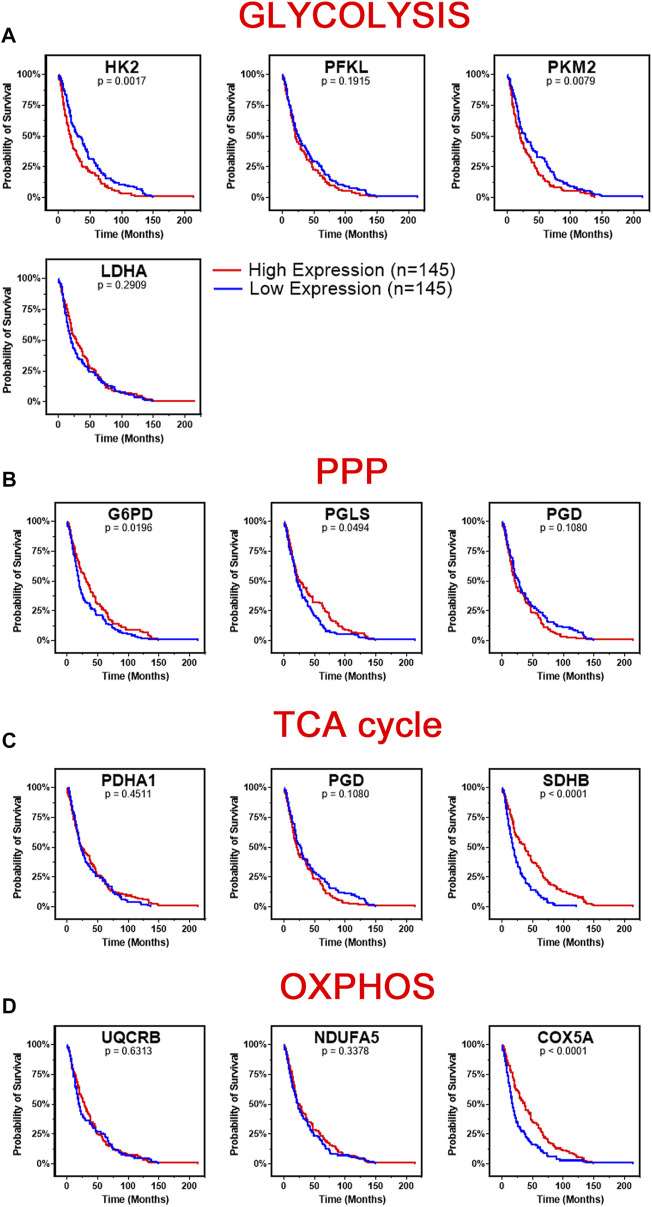
FIGURE 4.
Changes in gene metabolic gene expression is associated with poor patient prognosis. Shown are the Kaplan-Meier overall survival curves of GBM patients according to the designated gene expression levels above or below the median value based. (A) High expression of glycolysis related genes, HK2 and PKM2, correlated with poor overall GBM patient’s survival. There was no significant difference in survival based on PFKL or LDHA expression. (B) Low expression of PPP related genes, G6PD and PGLS, correlated with poor overall GBM patient’s survival. There was no significant difference in survival based on PGD expression. (C) Low expression of TCA related gene, SDHB, correlated with poor overall GBM patient’s survival. There was no significant difference in survival based on PDHA1 or PGD expression. (D) Low expression of OXPHOS related gene, COX5A, correlated with poor overall GBM patient’s survival. There was no significant difference in survival based on UQCRB or NDUFA5 expression. Gene expression in GBM tumors and associated patient survival from the REpository for Molecular BRAin Neoplasia DaTa (REMBRANDT) (GSE108476) via Affymetrix HG U133 V2.0 Plus gene expression chips. Gene expression was processed with MAS5 normalization on G-DOC® before comparison. Significance calculated via Log-rank (Mantel-Cox) test. Low expression, n = 145. High expression, n = 145. Exact p-values reported.

